
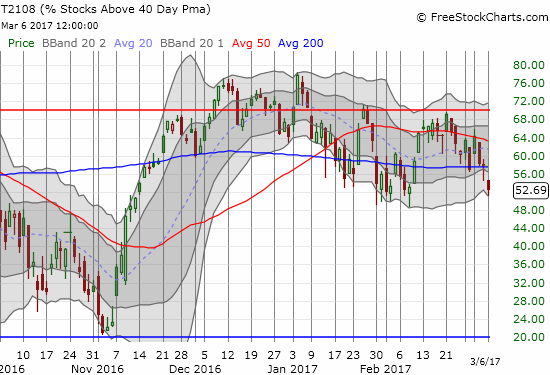
AT40 = 52.7% of stocks are trading above their respective 40-day moving averages (DMAs)
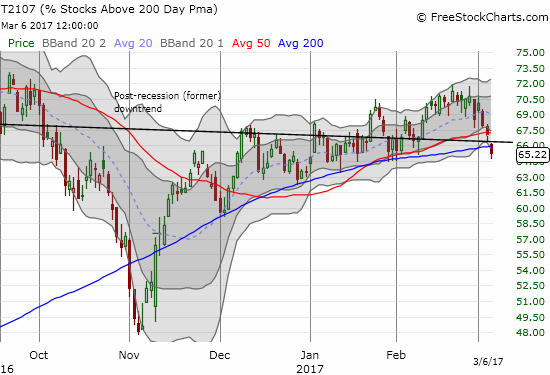
AT200 = 65.2% of stocks are trading above their respective 200DMAs
VIX = 11.2 (volatility index)
Short-term Trading Call: neutral
Commentary
Here we go again.
Divergence is rearing its head again and bringing a dose of reality to the setup for the S&P 500 (SPY). The index lost just 0.3% but closed just below its now former primary uptrend channel defined by the upper-Bollinger Bands (BBs). At the low of the day, the index effectively closed the gap from last week’s impressive breakout. I am surprised by this looming bearish action given the index seemed to face down the prospect of a March rate hike with confidence last Friday.
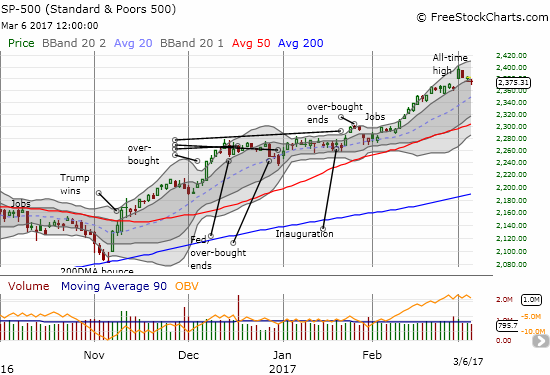
Without a close BELOW the gap, I did not flip my short-term trading call to bearish. However, the bearish tidings are coming from my favorite technical indicator, AT40 (T2108), and from AT200 (T2107).
AT40, the percentage of stocks trading above their respective 40-day moving averages (DMAs), closed at 52.7% which matches its closing low from the past 3 1/2 months. I daresay AT40 is still working on a VERY gradual reversal of its post-election gain.
AT200, the percentage of stocks trading above their respective 200DMAs, flagged a definitive change in tone by breaking down to 65.2%. This move not only ended AT200’s impressive uptrend, but also this move took AT200 below the former post-recession downtrend. While it is not quite time to get bearish, bullish momentum is definitely in trouble.
The growing bearishness tempts me to bet on increasing volatility going into next week’s meeting of the U.S. Federal Reserve. Yet the VIX barely provided a hint of interest in revving up its engines. While the VIX gained a fraction of a percent on the day, the volatility faded convincingly off its high of the day. This move caused pro-volatility products to close with solid losses.
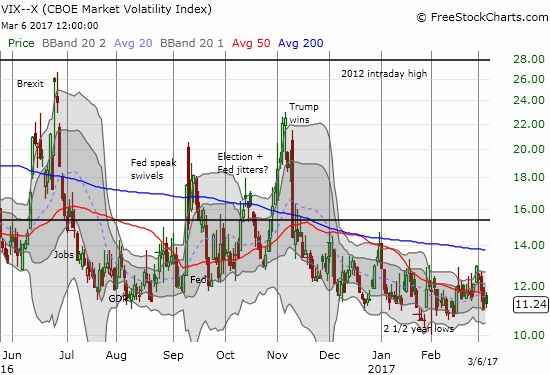
My temptation to bet aggressively on higher volatility is also tempered by the relatively benign history of periods of extremely low volatility like the current one (see “The Surprising Implications of Periods of Extremely Low Volatility“). The market’s reaction to next week’s Fed meeting could be an important juncture in determining whether this low volatility period lasts until May as history suggests is likely.
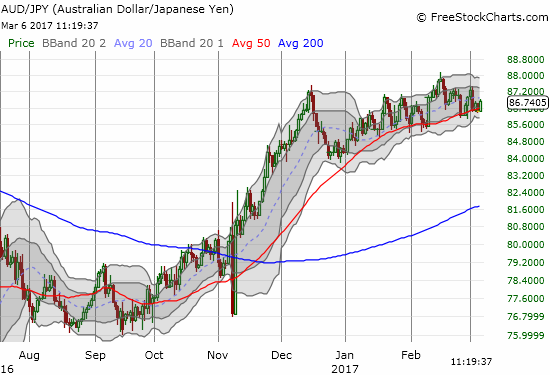
The currency market is on the edge of confirming a change in tone. The Australian dollar (FXA) versus the Japanese yen (JPY) is barely clinging to its uptrending support at its 50DMA. Tonight’s decision on monetary policy from the Reserve Bank of Australia (RBA) received market approval and allowed AUD/JPY to bounce gently off support. The RBA left interest rates unchanged and painted a picture of a very robust economy…
“The Australian economy is continuing its transition following the end of the mining investment boom, expanding by around 2½ per cent in 2016. Exports have risen strongly and non-mining business investment has risen over the past year. Most measures of business and consumer confidence are at, or above, average. Consumption growth was stronger towards the end of the year, although growth in household income remains low.”
Apparently, Australia is still looking good going into what will be a world record 104th consecutive quarter without a recession.
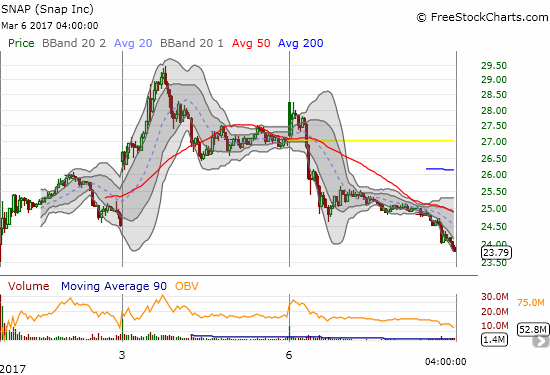
Among individual stocks, today’s apt symbol of potential trouble is Snap, Inc. (SNAP). The stock’s 12.3% loss on the day was a quick dose of reality that took SNAP right to the edge of its intraday low from the open of trading last Thursday. The stock first opened trading at $24 so today’s close at $23.77 could be considered a sign of trouble – almost everyone who rushed into SNAP after it began trading is sitting on a loss and speculative IPOs have a nasty habit of falling fast after they hit their first all-time low. After noting my reasons for bearishness on SNAP, I next had to face the possibility that buyers remained enthusiastic enough to put floors under SNAP. Now, the most important floor already looks ready to give way.
For the second day in a row, buyers loaded up in the pre-market and caused a gap up at the open. The outcome was decidedly different. After SNAP gapped up to $28.25, it nearly closed the gap in the first 5 minutes of trading, bounced, and then by 10:15am (Eastern) SNAP nosedived in a move that weighed on the stock for the rest of the day.
Once again, I am surprised at the unwillingness of the analyst community to participate in the hype machine that is the SNAP IPO. Two more important doses of reality greeted SNAP’s open. Over the weekend, Barron’s wrote a scathing piece claiming SNAP could lose half its value given its sky high valuation sitting on top of a poor financial engine. Needham called SNAP a “lottery stock” and slapped a $19 to $23 price target on the stock. From Barron’s:
“1) SNAP’s total addressable market (TAM) in is 80% smaller than FB’s; 2) SNAP already has 50% penetration of its TAM in the US; 2) SNAP has no ability to prevent ‘fast followers’ from stealing its best ideas; 3) Our $3.3B revenue estimate in 2019 requires SNAP to have a 14-16% share of Adjusted Mobile or Adjusted Digital Ad spending by 2019, up from 2% in 2016; 4) Even if SNAP grows revenue 8-fold to $3.3B by 2019, its share price would decline based on FB & GOOG EV/ Sales ratios; 5) no clear path to profitability before 2020; and 6) the academic literature suggests poor first-year performance.”
By the time the underwriters get their chance to hype up SNAP next month, they may have a LOT of work to do to pump SNAP back to life. I am still holding my short position. I would prefer to trade around the volatility in SNAP, but I am thinking there is a chance shares to short might dry up for small retail traders and investors. (I did see that Fidelity will offer shares to short starting Tuesday). I would consider covering if SNAP hit the teens ahead of the end of the quiet period for the underwriters. Otherwise, I will continue to brace for a roller coaster.
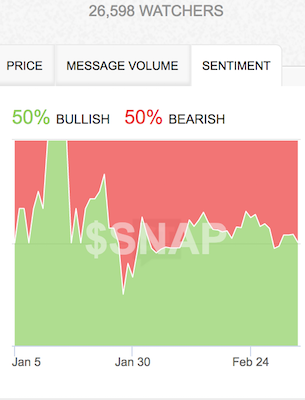
Source: StockTwits.com
— – —
FOLLOW Dr. Duru’s commentary on financial markets via email, StockTwits, Twitter, and even Instagram!
“Above the 40” uses the percentage of stocks trading above their respective 40-day moving averages (DMAs) to assess the technical health of the stock market and to identify extremes in market sentiment that are likely to reverse. Abbreviated as AT40, Above the 40 is an alternative label for “T2108” which was created by Worden. Learn more about T2108 on my T2108 Resource Page. AT200, or T2107, measures the percentage of stocks trading above their respective 200DMAs.
Active AT40 (T2108) periods: Day #262 over 20%, Day #82 over 30%, Day #81 over 40%, Day #79 over 50% (overperiod), Day #3 under 60% (underperiod), Day #28 under 70%
Daily AT40 (T2108)
")
Black line: AT40 (T2108) (% measured on the right)
Red line: Overbought threshold (70%); Blue line: Oversold threshold (20%)
Weekly AT40 (T2108)

*All charts created using freestockcharts.com unless otherwise stated
The charts above are my LATEST updates independent of the date of this given AT40 post. For my latest AT40 post click here.
Related links:
The T2108 Resource Page
You can follow real-time T2108 commentary on twitter using the #T2108 or #AT40 hashtags. T2108-related trades and other trades are occasionally posted on twitter using the #120trade hashtag.
Be careful out there!
Full disclosure: long UVXY call options, short AUD/JPY, short SNAP