
(T2108 measures the percentage of stocks trading above their respective 40-day moving averages [DMAs]. It helps to identify extremes in market sentiment that are likely to reverse. To learn more about it, see my T2108 Resource Page. You can follow real-time T2108 commentary on twitter using the #T2108 hashtag. T2108-related trades and other trades are occasionally posted on twitter using the #120trade hashtag. T2107 measures the percentage of stocks trading above their respective 200DMAs)
T2108 Status: 65.6%
T2107 Status: 69.0%
VIX Status: 11.1
General (Short-term) Trading Call: bearish
Active T2108 periods: Day #233 over 20%, Day #53 over 30%, Day #52 over 40%, Day #50 over 50%, Day #1 over 60% (overperiod), Day #13 under 70%
Commentary
In the last T2108 Update I made the case for staying bearish on the S&P 500 (SPY) and the stock market in general. Today, the S&P 500 (SPY) did its best to invalidate the growing bearish signals by rallying to a new all-time high.
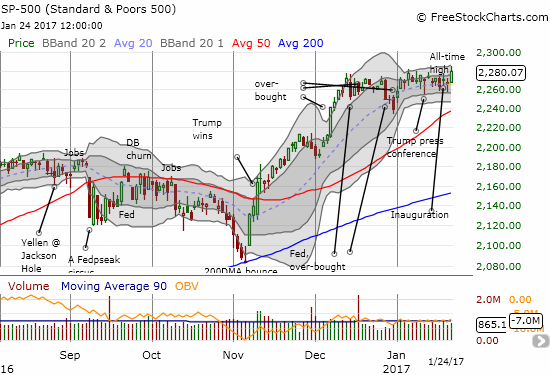
The 0.7% gain came amid a collection of bullish market signals. Yet, while the S&P 500 hurtled over one of my criteria for flipping back to bullish, T2108, the percentage of stocks trading above their respective 40-day moving averages (DMAs), failed to cooperate. My favorite technical indicator performed well on the day, but it did not recover overbought status (above 70%). T2108 even closed right at its own 20 and 50DMAs.
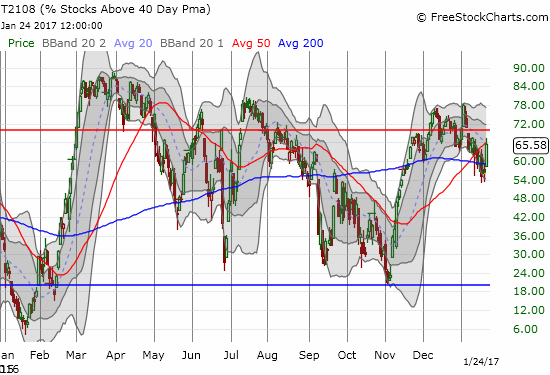
As a reminder, my (revised) T2108 trading rules flag overbought status as a sign of buyer’s strength. Falling out of overbought status is bearish. As a result, I have been cautiously bearish and now bearish since January 9th when T2108 fell from the last overbought period. Ideally, such a fall leads to sustained momentum to the downside and a trip to, or close enough to, oversold conditions to signal the next bullish period. Instead, the S&P 500 has defied gravity with a tantalizing trading range for 6 or 7 weeks during which time T2108 fell from overbought conditions three times. T2108’s behavior was the biggest footnote to an otherwise bullish day.
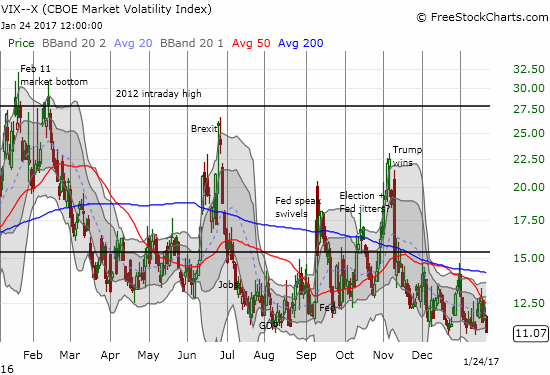
The second footnote was a reminder to stay cautious. The volatility index, the VIX, dropped to a 2 1/2 year low. Since last August, the VIX has bounced from these levels, leading to pullbacks of varying degrees. In other words, the VIX sits at a dangerous level of complacency. If the stock market continues higher, this cautionary footnote will loom ever larger.
Now enough of the caution and the negative – here are some peeks at how the bulls and buyers are celebrating the positives…
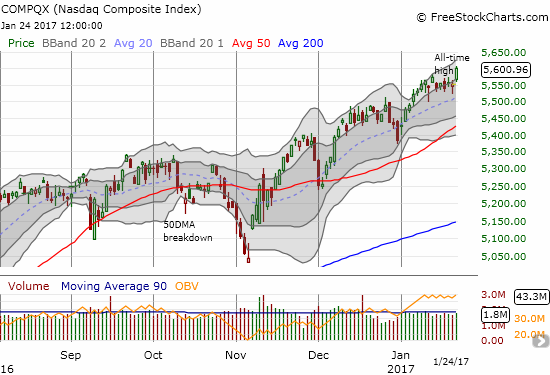
The NASDAQ (QQQ) jumped to a new all-time high with a 0.9% gain. This move looks a lot better than the S&P 500’s move: it follows a well-defined uptrend formed after the sharp 2-day sell-off that ended 2016. The NASDAQ is up 4.0% year-to-date and out-performing the S&P 500’s 1.8% year-to-date gain.
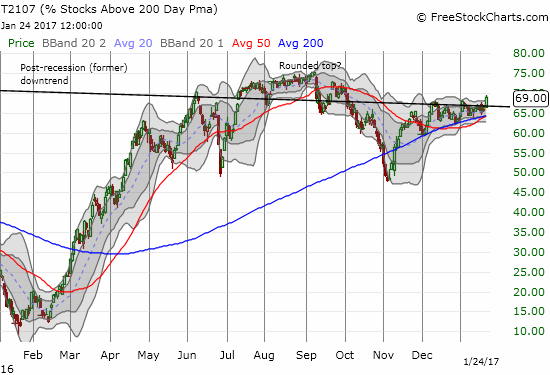
T2107, the percentage of stocks trading above their respective 200DMAs, was almost as impressive as the NASDAQ. This measure of longer-term health in the stock market broke out cleanly to a new 3+ month high. T2107 is trending upward and looks like it broke out from a bullish wedge pattern. T2107 also happened to launch off the former post-recession downtrend line.
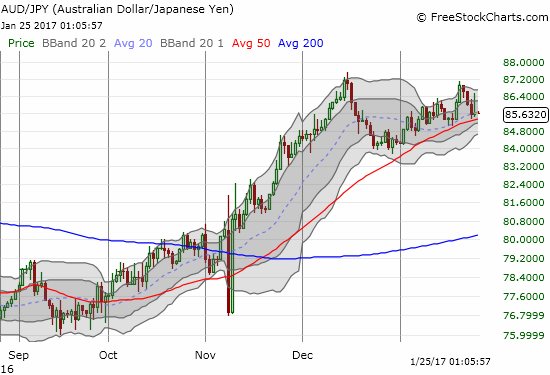
The currency market is chimed in with a bullish signal from the Australian dollar (FXA) and the Japanese yen (FXY). AUD/JPY bounced off its uptrending 20DMA which now hovers just above an uptrending 50DMA. Note that at the time of writing the Australian dollar sold off sharply after the Australian Bureau of Statistics released inflation data for 2016’s December quarter.
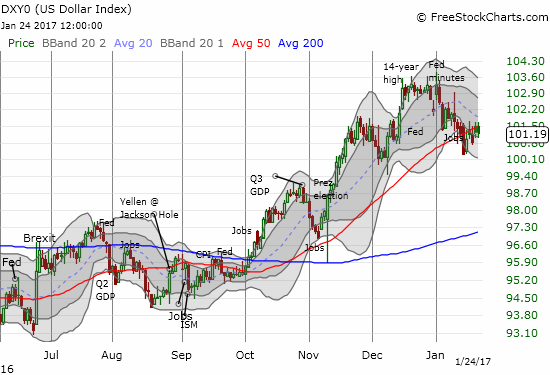
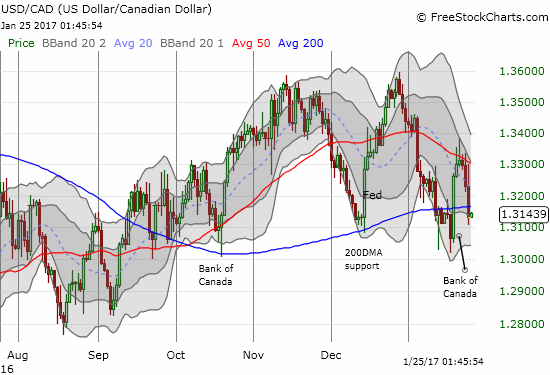
The U.S. dollar index (DXY0) is doing a cling of its own. Its 50DMA is still trending upward, and the index is trying to hang on. I expect the declining 20DMA to take over as the primary (short-term) trend despite my bullishness, for example, on the U.S. dollar versus the Canadian dollar. I am in steady accumulation mode on USD/CAD in anticipation of the next move higher.
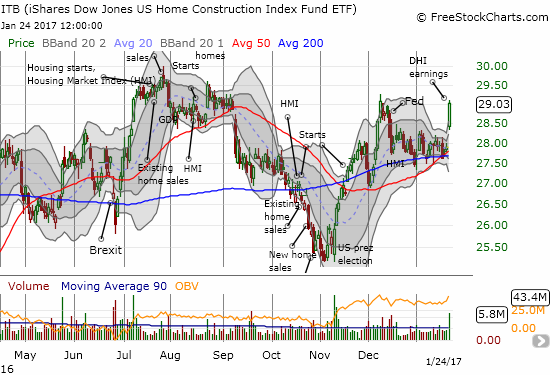
Home building is one sector of the market for which I use different rules (see my housing market reviews for more details). I wrote last week that immediate policy rollbacks by President Trump included a negative for the housing market. Now earnings have taken over. D.R. Horton, Inc. (DHI) soared 6.6% on a very positive response to its earnings. This move helped power the iShares US Home Construction (ITB) upward 4.0%. ITB closed just short of its December high; the breakout essentially confirmed the 20 and 50DMAs as support. This move happened on a day when interest rates ticked higher. I am well overdue for some detailed reviews of earnings from home builders (stay tuned).
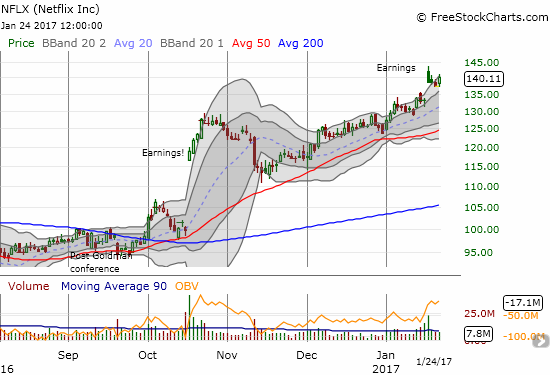
Netflix (NFLX) followed tech to a new all-time closing high. NFLX now looks ready to invalidate the potential bearishness of its “gap and crap” response to the latest earnings report. The upper-Bollinger Bands continue to define a notable uptrend for NFLX.
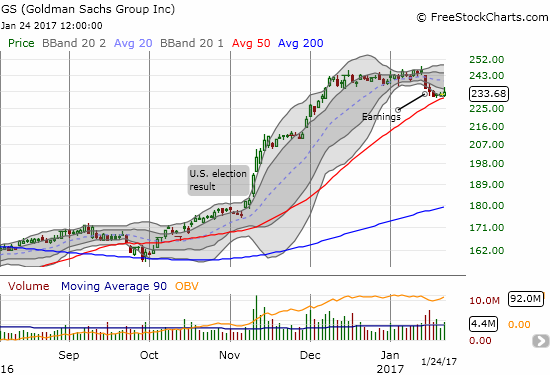
Financials made a bid to end the slow drip off recent highs. Most importantly, Goldman Sachs (GS) bounced off 50DMA support for a marginal gain. However, the stock did fade well off its high for the day. I am watching VERY closely for the resolution of this important test of support!
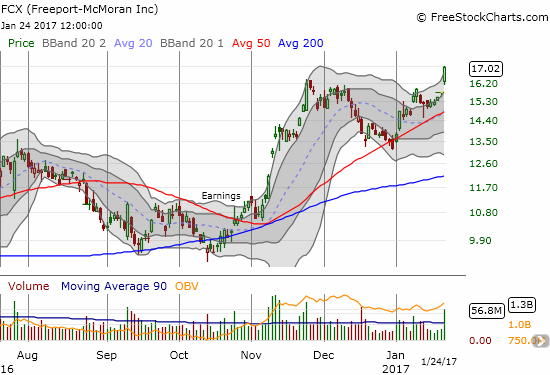
Commodities made big moves. For example, one day ahead of earnings, Freeport-McMoRan Inc. (FCX) soared 8.3% to a new 1 1/2 year high. FCX confirmed another test of support at its 50DMA.
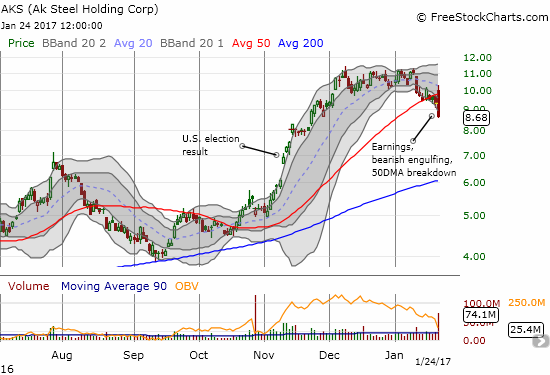
Just when I thought the industrial sector was on the move in unison, I noticed steel stock AK Steel Holding Corporation (AKS) drop 6.6% in response to earnings. The high volume selling delivered a triple-whammy to AKS: a bearish engulfing top, a 50DMA breakdown, and confirmation of resistance at the downtrending 20DMA. I will be watching closely to see whether buyers who have auto-flocked to these names will soon overlook the bad news in earnings and choose instead to fall back in line with the Trump-theme trade.
Putting things all together, I am keeping the short-term trading call growling with the bears. This choice is more out of a desire to reduce churn in the trading call rather than coming from a firm conviction. The bulls are once again writing all over the walls, so I do not expect this bearish trading call to last much longer. Time will soon tell…
— – —
FOLLOW Dr. Duru’s commentary on financial markets via email, StockTwits, Twitter, and even Instagram!
Daily T2108 vs the S&P 500
")
Black line: T2108 (measured on the right); Green line: S&P 500 (for comparative purposes)
Red line: T2108 Overbought (70%); Blue line: T2108 Oversold (20%)
Weekly T2108

*All charts created using freestockcharts.com unless otherwise stated
The charts above are the my LATEST updates independent of the date of this given T2108 post. For my latest T2108 post click here.
Related links:
The T2108 Resource Page
Be careful out there!
Full disclosure: long SDS, long USD/CAD, short AUD/JPY, long ITB call options, long FCX