
(T2108 measures the percentage of stocks trading above their respective 40-day moving averages [DMAs]. It helps to identify extremes in market sentiment that are likely to reverse. To learn more about it, see my T2108 Resource Page. You can follow real-time T2108 commentary on twitter using the #T2108 hashtag. T2108-related trades and other trades are occasionally posted on twitter using the #120trade hashtag. T2107 measures the percentage of stocks trading above their respective 200DMAs)
T2108 Status: 77.9% (overbought day #2)
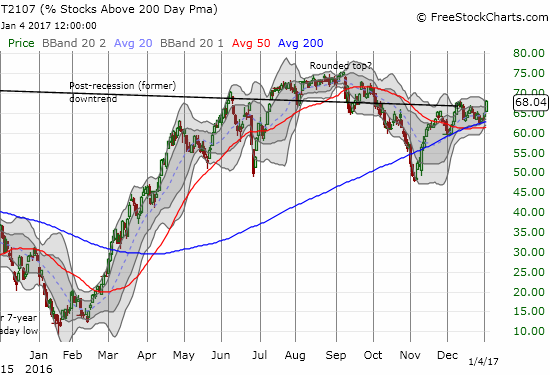
T2107 Status: 68.0%
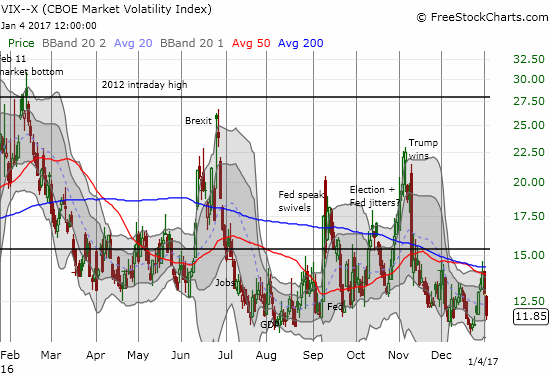
VIX Status: 11.9
General (Short-term) Trading Call: cautiously bearish
Active T2108 periods: Day #219 over 20%, Day #39 over 30%, Day #38 over 40%, Day #36 over 50%, Day #30 over 60%, Day #2 over 70%
Commentary
No, I am not talking about the maddening Dow 20K watch. I continue to ignore the Dow Jones Industrial Average (DIA) as much as ever because of its price-weighting and tiny sample of the market even as it carries a lot of psychological weight for many. For a complete discussion on this topic, see the excellent episode of Planet Money below.
Instead, I am talking about the S&P 500 (SPY). The index only rallied 0.6% on the day, but it came just one point short of a fresh all-time high. I am waiting for a breakout to motivate me to change the short-term trading call from cautiously bearish to (cautiously?) bullish.
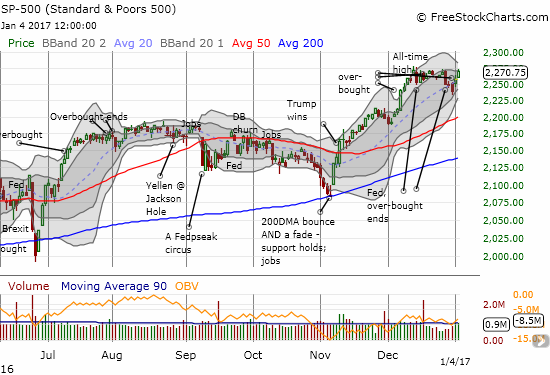
As the Bollinger Band (BB) squeeze tightened around the S&P 500, my favorite technical indicator, T2108 (the percentage of stocks trading above their respective 40-day moving averages (DMAs)), delivered an impressive vote of confidence in an upside breakout. T2108 closed at 77.9%; it cleared the recent trading range with a downward bias for a 6-month high. T2107, the percentage of stocks trading above their respective 200DMAs was also impressive: it put an end to the recent downtrend and closed at 68.0%, a 3-month high. If the S&P 500 manages to break out, T2107 will support the sustainability of such a move.
The volatility index, the VIX, was of course smashed. The VIX lost 7.8% to close at 11.9. It is right back to the edge of its lowest levels in recent trading.
This trading day was another one for watching, but the watching had me on the sidelines as Tesla Motors (TSLA) FINALLY confirmed its 200DMA breakout with a 4.6% surge. It was a picture-perfect bounce off the 200DMA as support. After I saw TSLA go from a gap down to a 1% gain, I put in a lowball offer for call options. The stock simply never looked back. Once (if?) I flip the short-term trading call to (cautiously?) bullish, I will be stuck looking for ANY pullback to hop on TSLA’s speeding train. Note in the chart below how well TSLA is holding an uptrend through the upper-Bollinger Bands.
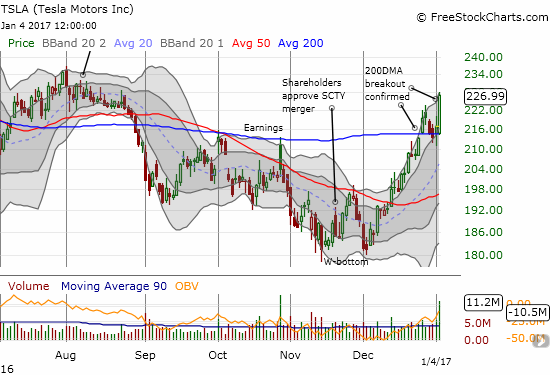
I should have tried a setup which split my order into two: one half for the lowball, desired price and the other half for “stopping IN” the position if the rally continued past a bullish threshold. Next time…
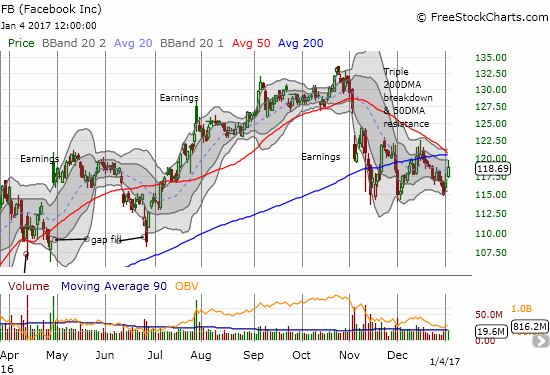
Facebook (FB) is another chart I put on watch last month. A month ago, I described how FB was breaking down from a technical perspective. I also wondered allowed whether the new year would bring back the buyers. FB rallied from the point of that post, failed 200DMA resistance, and retested that December low by the end of the year. Right on schedule, FB jumped the first two trading days of this year. However, overhead resistance looms even larger now with converging 50 and 200DMAs. As a result, FB still looks like a stock breaking down albeit in slow motion (talk about tantalizing). Watch out though if FB breaks through resistance.
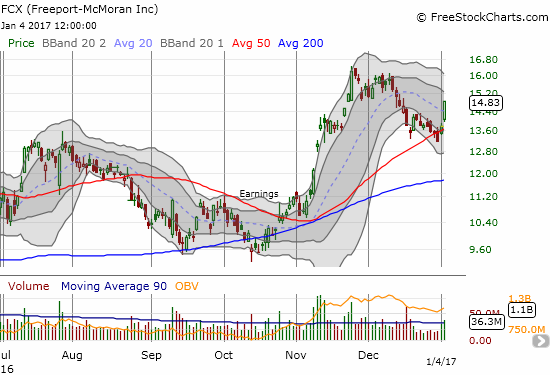
Freeport-McMoran (FCX) came back to life today and surged 7.6%. Given the buying volume to start the year, I am assuming FCX successfully tested 50DMA support. (Note that I do not include commodities in my short-term trading call since they are generally uncorrelated with the stock market).
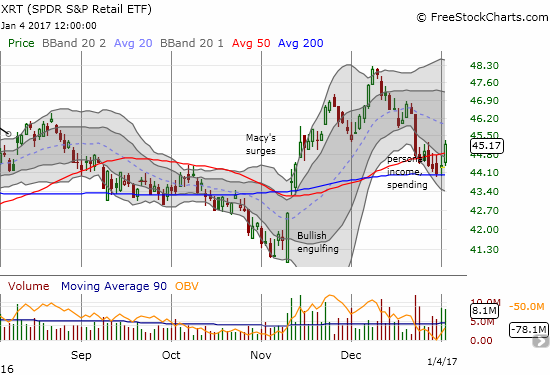
SPDR S&P Retail ETF (XRT) jumped 1.9% on the day in a move that confirmed 200DMA support and closed XRT above 50DMA resistance. However, fundamentals may ruin the entire mood on Thursday as Macy’s (M) delivered bad earnings news in after hours trading to the tune of a 10% sell-off.
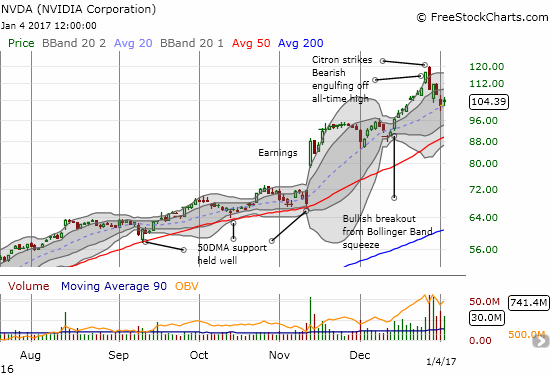
The Nvidia (NVDA) watch continues. The first two days of the trading year brought some stability to the stock as the 20DMA held as support after an initial gap down and a trade as low as $99.38. Trading volume remains extremely high so there is a good possibility that distribution is unfolding here (distribution is essentially the selling of stock from one group, who are generally locking in profits, to another group who will end up holding the bag).
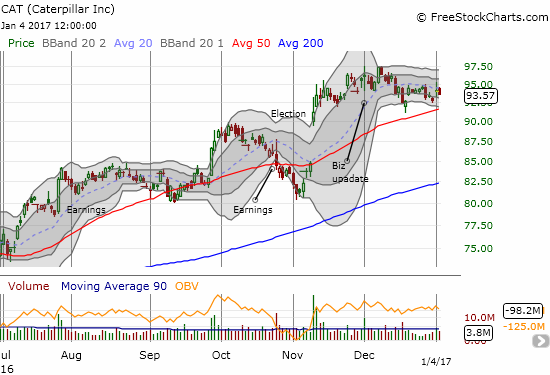
Finally, tantalizing the prospects of a bullish breakout are Caterpillar (CAT) and the Australian dollar (FXA) versus the Japanese yen (FXY). I expect CAT to confirm bullish undertones in the market and instead it is still ringing out the cautious tone I emphasized going into this overbought period. CAT even underperformed the market with a 0.5% loss on the day.
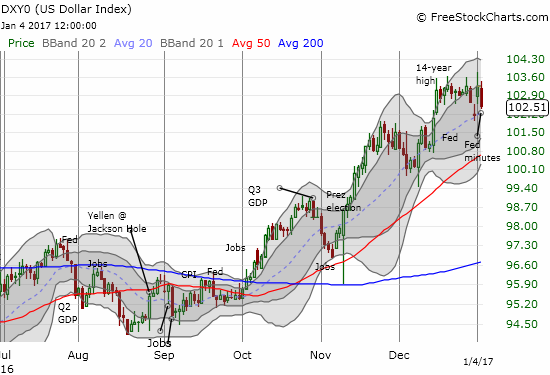
AUD/JPY held steady above 50DMA support to end 2016. It looked set to confirm that support with the year starting on two strong days. Fortunes have turned since then as the yen gained renewed strength thanks to renewed weakness in the U.S. dollar index in general (DXY0). Presumably, the sharp drop in the dollar came in the wake of the market’s interpretation of the minutes of the December Federal Reserve meeting. I think the market is coming to my interpretation that the Fed was NOT trying to be particularly hawkish. This sets up for a potentially dramatic response to the December jobs report coming this Friday. Stay tuned!

— – —
FOLLOW Dr. Duru’s commentary on financial markets via email, StockTwits, Twitter, and even Instagram!
Daily T2108 vs the S&P 500
")
Black line: T2108 (measured on the right); Green line: S&P 500 (for comparative purposes)
Red line: T2108 Overbought (70%); Blue line: T2108 Oversold (20%)
Weekly T2108

*All charts created using freestockcharts.com unless otherwise stated
The charts above are the my LATEST updates independent of the date of this given T2108 post. For my latest T2108 post click here.
Related links:
The T2108 Resource Page
Be careful out there!
Full disclosure: long SDS, long and short positions on the U.S. dollar, long NVDA call options, long FCX call options, short AUD/JPY, long CAT put and call options