
(T2108 measures the percentage of stocks trading above their respective 40-day moving averages [DMAs]. It helps to identify extremes in market sentiment that are likely to reverse. To learn more about it, see my T2108 Resource Page. You can follow real-time T2108 commentary on twitter using the #T2108 hashtag. T2108-related trades and other trades are occasionally posted on twitter using the #120trade hashtag. T2107 measures the percentage of stocks trading above their respective 200DMAs)
T2108 Status: 70.7%
T2107 Status: 64.9%
VIX Status: 12.9
General (Short-term) Trading Call: cautiously bearish
Active T2108 periods: Day #218 over 20%, Day #38 over 30%, Day #37 over 40%, Day #35 over 50%, Day #29 over 60%, Day #1 over 70% (first overbought day ended 3 days under 70%)
Commentary
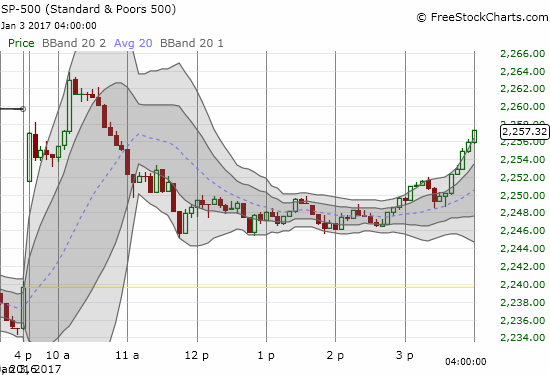
Last year ended on a cautionary note. This year, 2017, started with an attempt to resume the market’s previous roar. The 5-minute chart below for the S&P 500 (SPY) shows a sharp sprint at the open, followed by an extended pullback, stabilization, and finally a strong close.
On the daily chart, note that the 0.9% gain closed the index above its intraday high that ended 2016. This close was enough to preserve the overbought reading that started the day. Overall this move represents a tentative return to overbought trading conditions given buyers had to rescue the S&P 500 from intraday lows. The NASDAQ (QQQ) also gapped up at the open, but its close was not quite as favorable as the S&P 500’s even with the same 0.9% gain.
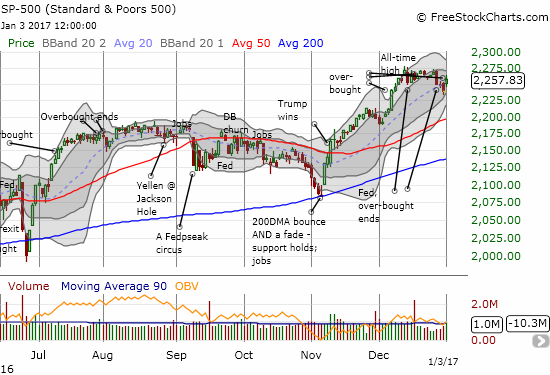
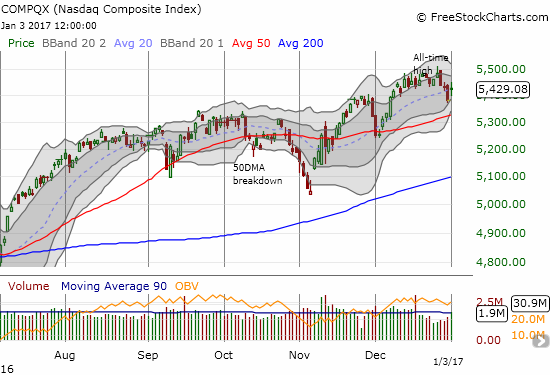
After some wild swings, T2108, the percentage of stocks trading above their respective 40-day moving averages (DMAs), ended the day overbought. This is the third overbought period in almost four weeks. The resolution of this churn will likely mark trading for weeks to come. Conveniently, a Bollinger Band (BB) squeeze is forming for both major indices. As a reminder a BB-squeeze forms as volatility compresses. The BBs are shown in my charts with grey shading and define one and two standard deviations from the 20DMA. The BB-squeeze typically ends with a large and sustained move upward or downward. The breakout or breakdown from this squeeze should be particularly convincing and valuable to trade. I am keeping the short-term trading call at “cautiously bearish” because the S&P 500 did not make a new all-time high on this return to overbought territory.
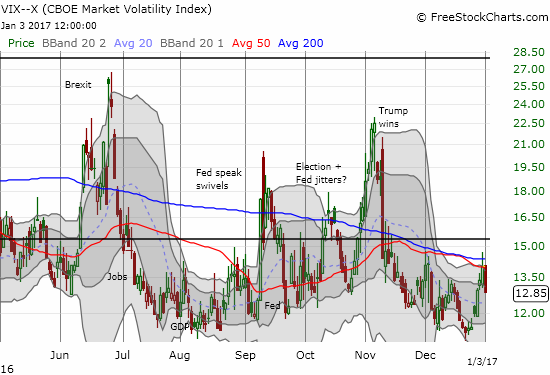
Traders smashed the volatility index, the VIX, on the way to scooping up stocks. The 8.5% drop was very dramatic since it started at resistance at the converged 50 and 200DMAs.
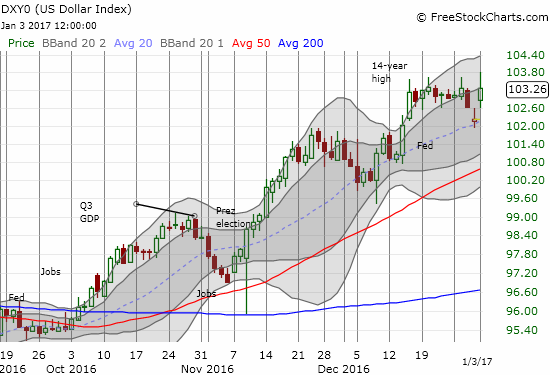
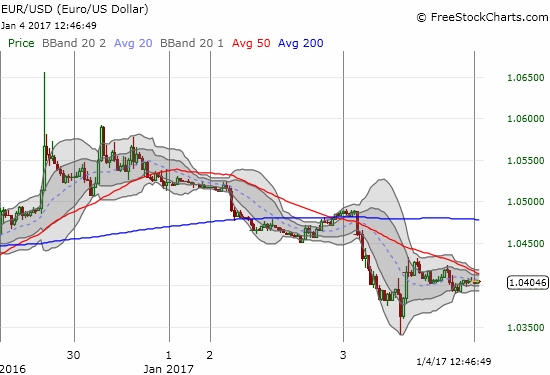
The U.S. dollar index (DXY0) delivered the biggest surprise of the day for me. It soared 1.0% in a move the erased its entire loss from the last day of 2016. At one point the index printed a fresh 14-year high. This move was particularly impressive given the brief surge the euro (FXE) experienced against the U.S. dollar at the beginning of Asian trading ahead of the New Year (someone was in too much a hurry to buy those euros!). The stock market clearly was not overly concerned with dollar strength.
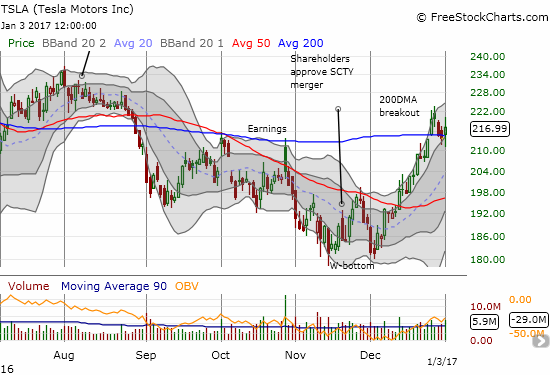
This was a day mainly for watching. As a reminder I am watching Tesla (TSLA) like a hawk. I am still waiting for resolution of this 200DMA breakout that is now struggling to hold onto support…
— – —
FOLLOW Dr. Duru’s commentary on financial markets via email, StockTwits, Twitter, and even Instagram!
Daily T2108 vs the S&P 500
")
Black line: T2108 (measured on the right); Green line: S&P 500 (for comparative purposes)
Red line: T2108 Overbought (70%); Blue line: T2108 Oversold (20%)
Weekly T2108

*All charts created using freestockcharts.com unless otherwise stated
The charts above are the my LATEST updates independent of the date of this given T2108 post. For my latest T2108 post click here.
Related links:
The T2108 Resource Page
Be careful out there!
Full disclosure: long SDS, short EUR/USD