
(T2108 measures the percentage of stocks trading above their respective 40-day moving averages [DMAs]. It helps to identify extremes in market sentiment that are likely to reverse. To learn more about it, see my T2108 Resource Page. You can follow real-time T2108 commentary on twitter using the #T2108 hashtag. T2108-related trades and other trades are occasionally posted on twitter using the #120trade hashtag. T2107 measures the percentage of stocks trading above their respective 200DMAs)
T2108 Status: 54.0%
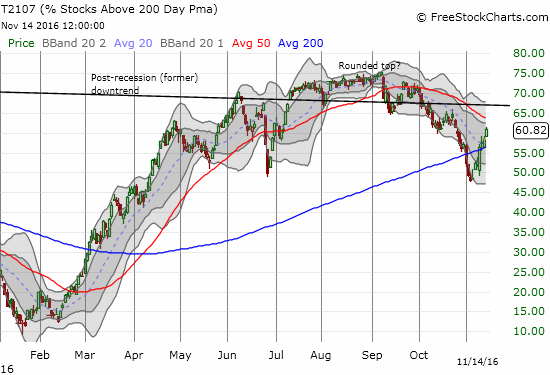
T2107 Status: 60.8%
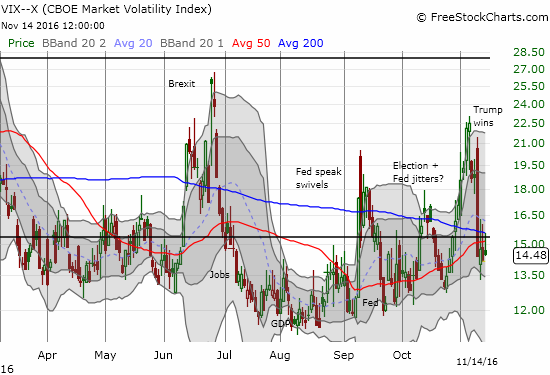
VIX Status: 14.5
General (Short-term) Trading Call: bullish
Active T2108 periods: Day #185 over 20%, Day #5 over 30%, Day #4 over 40%, Day #2 over 50% (overperiod), Day #49 under 60%, Day #75 under 70%
Commentary
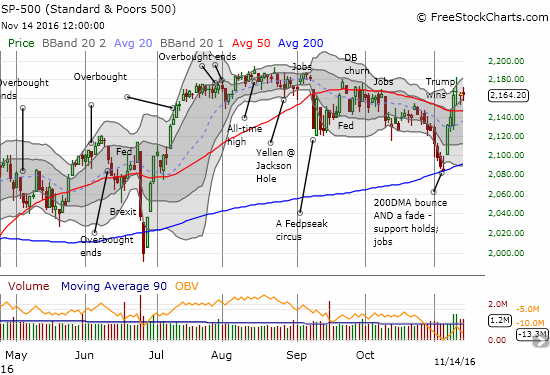
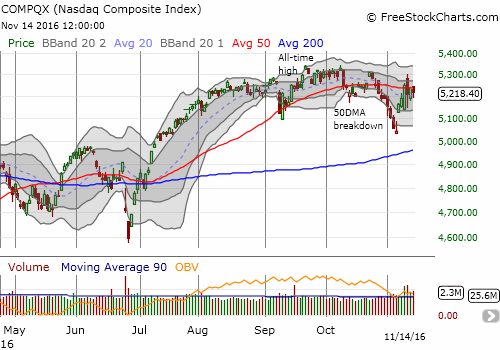
Financial markets are on Day #4 of post-election trading and plenty of momentum remains in Trump-related stocks. However, the S&P 500 (SPY) has largely missed out for the past 3 days. Since the rally on Day #1, the index has gone exactly nowhere. The tech-laded NASDAQ (QQQ) is DOWN slightly and today closed below its 50-day moving average (DMA) again.
T2108, the percentage of stocks trading above their respective 40DMAs, is a handy reminder that the underlying fundamentals of the overall stock market remain strong. In other words, the market has hidden momentum. If the S&P 500 traded just a little worse, I would label this hidden momentum as a bullish divergence. Instead, it is just plain bullish.
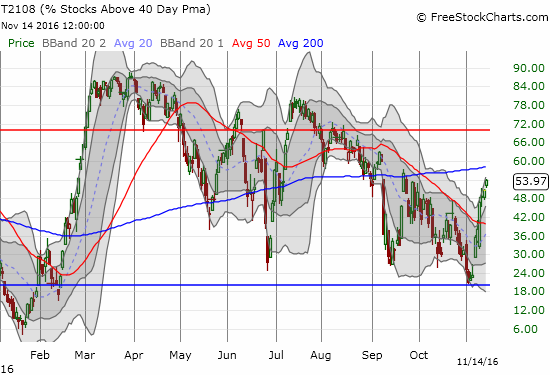
T2108 soared enough to end the downtrend that dogged my favorite technical indicator since July. The toppy action from February is still in place, but those were extremely extended and rare overbought conditions. T2107, the percentage of stocks trading above their respective 200DMAs, is a better sign that the longer-term view has not quite healed. T2107 has surged from around 48% to 61%, but I would like to see it get above the post-recession downtrend line. The good news here is that a rally to that level will lift a lot of boats higher.
The volatility index, the VIX, supports the bullish thesis by trading just under the 15.35 pivot. Yet, I am starting to eye warily the ability of the index to maintain slightly inclined support drawn from the August low.
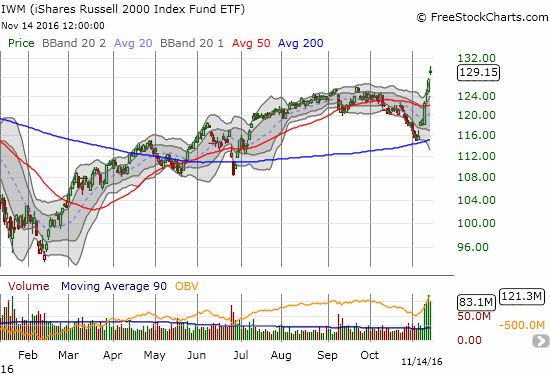
Small-caps are some of strongest supporters of the new bullish thesis. At the end of October, I pointed to iShares Russell 2000 (IWM) as part of a strong bearish divergence in the stock market. The election instantly transformed IWM as it has now cracked fresh highs for the year in a very dramatic change of events!
Financials delivered another strong push to the market’s underlying momentum. I have yet to hop aboard because I want to buy a dip. This movement straight up like a rocket is truly awesome to behold. A buyable dip may end up consisting of just the reversal of one day’s trading!
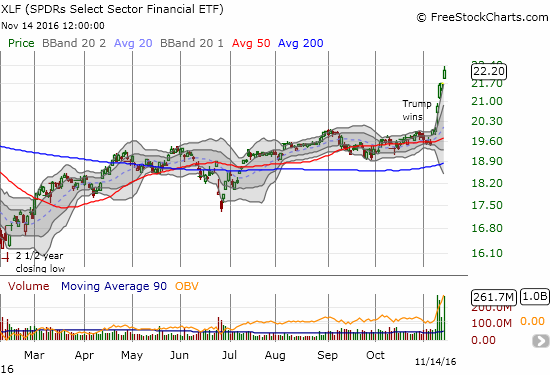
Financials are benefiting indirectly from Trump. The accepted narrative is Trump’s stimulus program of massive tax cuts and infrastructure spending is going to bring the inflation that has as yet eluded the entire industrialized world since the financial crisis. Fear of inflation is driving bond yields higher and increasing market expectations for Fed rate hikes. Higher rates allow financial institutions more profit margins as the spreads between short-term (borrow) and long-term (lend) rates widen. (With bonds selling off so sharply, I am starting to wonder whether bond losses could also hurt these same financial institutions?)
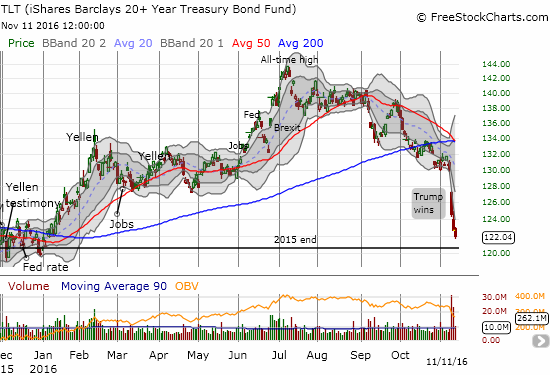
Players in the bond market are not waiting around for Trump’s inauguration to confirm the narrative. With interest rates so low, too much is at stake. There are even fears that Trumps plans could add $5.3 trillion in additional government borrowing. With the Republicans in full control of government, there will be little standing in the way of additional spending and deficits…except the bond market itself. The bond sell-off has been infectious with reportedly $1 trillion in value now wiped out in the global bond market.
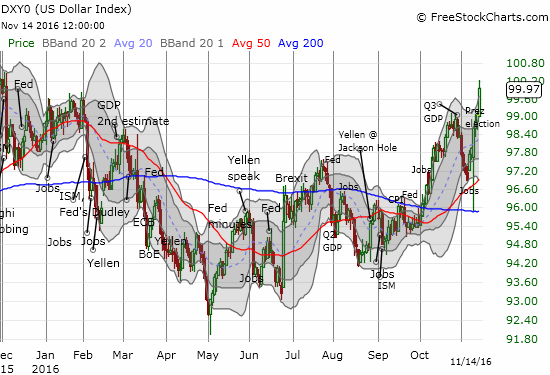
The U.S. dollar index (DXY0) also continues to benefit from the post-election Trump narrative. The soaring rates in the U.S. are causing a larger spread with other bond markets and making the dollar relatively more attractive. So the prospect of ballooning government deficits does not concern the market for now even as these higher rates make government borrowing more and more expensive. The dollar index touched the magic 100 number briefly today for the first time in a year. As I promised in an earlier post, I have closed out part of my net dollar long position to lock in profits here.
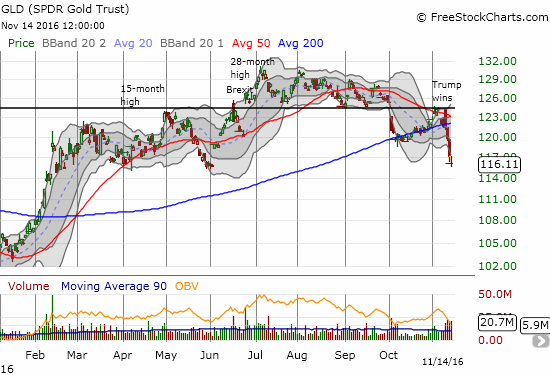
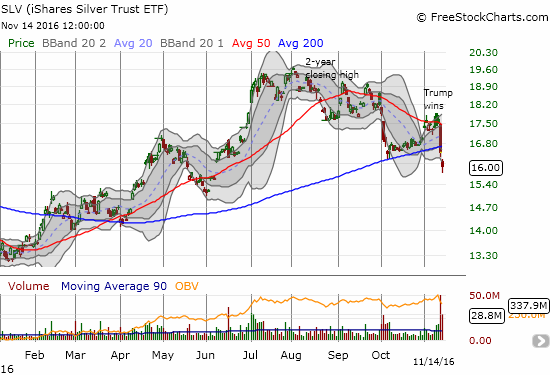
The higher yields and stronger dollar are really doing a number on precious metals. The SPDR Gold Shares (GLD) is on its fifth day of a 200DMA breakdown and is testing the low from May. The iShares Silver Trust (SLV) finally followed suit on Friday with its own 200DMA breakdown. The hesitation from SLV was probably related to the overall global rally in industrial commodities in anticipation of demand from a massive U.S. infrastructure buildout. I could not resist this opportunity to speculate one more time on an eventual bounceback. I started buying December call options on Friday and added to them today. The call options expire right after the Federal Reserve’s December rate decision so this position should at least be a great hedge against a Fed surprise. (I remain baffled as to why so many pundits and even gold bugs assumed gold would soar post-Trump, like some kind of pre-apocalypse trade. I have never liked gold as a hedge against or play on fear).
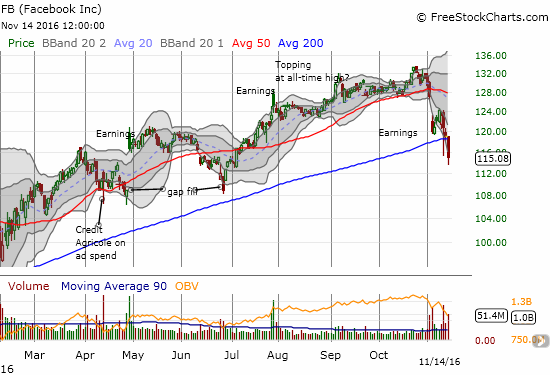
The rotation out of tech stock darlings continued in earnest. I tried to play Facebook (FB) on Friday as a darling that could hold 200DMA support. That support failed dramatically on the day. I am now standing down on these plays until the trading behavior firms up and looks at least less bearish.
The industrial sector must be sucking up a bunch of tech money. The anticipated industrial revival is sending skyward a vast array of related stocks. Two industrial stocks that I have my eye on are long favorites that I failed to buy back on the most recent sell-offs. Allegheny Technologies Inc. (ATI) is on the edge of a breakout and has 19.7% of its float sold short. The run-up could actually accelerate on a breakout. TimkenSteel Corporation (TMST) is still below book value and is on the verge of breaking out above its high for the year. Of course on both of these stocks I am trying to wait for some kind of cooling off period before making my plunge. But I am also willing to play a breakout, especially on ATI, on the assumption of the start of a new bullish phase.
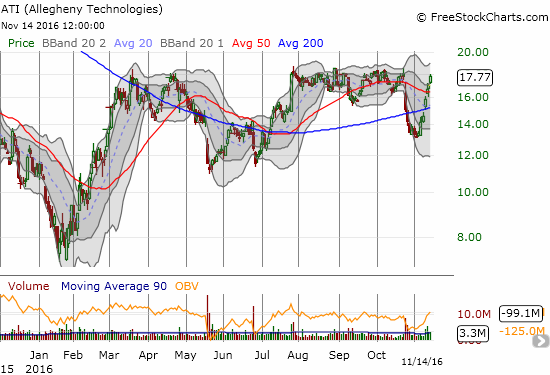
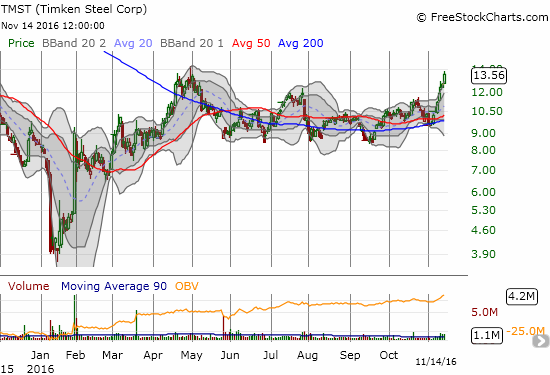
In a “normal” world, both ATI and TMST would stop rallying right here and cool off simply from technical resistance. Buyers SHOULD take a breather at such natural stopping points to more coolly assess the market opportunities. Yet, this post-Trump world is far from normal…financial markets are soaring on the prospect of a Republican President expanding U.S. deficits, launching massive industrial projects, AND threatening to realign global trade deals more more in favor of the U.S. This entire dynamic is thoroughly fascinating even if a lot of privatization underlies much of what is coming.
I acknowledge that the current narrative may carry the seeds of its own destruction. At some point, bond yields should get high enough to make stocks a lot less attractive in comparison. At some point, some of the subtle contradictions in the narrative may generate more doubts about the logic of the rally and cause a substantial pullback. Yet, as I have argued earlier, these Presidential narratives have historically delivered very strong and sustained results. So, I am giving the current narrative a major benefit of the doubt for now.
— – —
FOLLOW Dr. Duru’s commentary on financial markets via email, StockTwits, Twitter, and even Instagram!
Daily T2108 vs the S&P 500
")
Black line: T2108 (measured on the right); Green line: S&P 500 (for comparative purposes)
Red line: T2108 Overbought (70%); Blue line: T2108 Oversold (20%)
Weekly T2108

*All charts created using freestockcharts.com unless otherwise stated
The charts above are the my LATEST updates independent of the date of this given T2108 post. For my latest T2108 post click here.
Related links:
The T2108 Resource Page
Be careful out there!
Full disclosure: long UVXY shares and long UVXY put, long GLD, long SLV shares and calls, long TLT calls, long FB call options, long TLT call options