
(This is an excerpt from an article I originally published on Seeking Alpha on November 2, 2016. Click here to read the entire piece.)
In early August, I wrote “Awaiting The Next Sell Signal As The S&P 500 Enters The Season’s ‘Danger Zone’” as a way of analyzing the prospects for a significant sell-off by the end of October. {snip}
{snip} Yet, THIS year, the largest drawdown these three months of danger could muster was -2% in September and October. Given that November begins a seasonally strong period for stocks, I decided to see whether a “calm” August to October has historically had any significance. I posted my data and calculations on my Google Drive for such data. (See Fidelity’s “Halloween Indicator” for a concise analysis of the S&P 500’s seasonal history split between November to April…{snip})
{snip} This year qualifies as one with a calm danger zone. It turns out that since 1950 there are only 14 such years, including 2016, or 21% of years. This percentage makes 2016 a unique year.
{snip} In other words, those years where August to October fail to deliver the expected tumult, overall performance for the year benefits. This year has a LOT of catching up to do as year-to-date performance is “only” 3.3%. If the year ended here, 2016 would become the worst performing of ALL the calm years…by a longshot. The current worst performing calm year is 1993 at 7.1%.
{snip} This year, August through October delivered a return of -2.2%, the worst of the calm years…again by a longshot. The second worst performer was 1983 with a 0.6% gain.
{snip} The combined performance of November and December averaged 2.6% in calm years and 3.2% in not-calm years.
So we have a tension between the expected performance of November to December conditioned on the maximum drawdown from August to September and the expected performance of the year conditioned on this same maximum drawdown during the danger zone. {snip}
{snip} Although the danger zone did not deliver the telling blow of a large drawdown, it DID communicate growing divergences that I used as warning signals. The S&P 500 now sits at the edge of oversold trading conditions. Following history would mean buying aggressively any dip into oversold territory in the coming days or weeks.
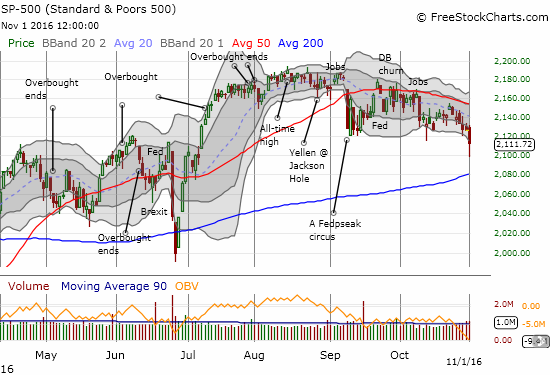
Source: FreeStockCharts.com
Be careful out there!
Full disclosure: long SDS
(This is an excerpt from an article I originally published on Seeking Alpha on November 2, 2016. Click here to read the entire piece.)