
(T2108 measures the percentage of stocks trading above their respective 40-day moving averages [DMAs]. It helps to identify extremes in market sentiment that are likely to reverse. To learn more about it, see my T2108 Resource Page. You can follow real-time T2108 commentary on twitter using the #T2108 hashtag. T2108-related trades and other trades are occasionally posted on twitter using the #120trade hashtag. T2107 measures the percentage of stocks trading above their respective 200DMAs)
T2108 Status: 41.0%
T2107 Status: 64.6%
VIX Status: 14.4
General (Short-term) Trading Call: neutral
Active T2108 periods: Day #169 over 20%, Day #25 over 30%, Day #1 over 40% (overperiod), Day #13 under 50%, Day #29 under 60%, Day #55 under 70%
Commentary
When I last posted my T2108 Update, my favorite technical indicator was flirting with oversold levels (below 20%). As I suspected at the time, T2108 turned around and treated that test as “close enough” to oversold. The path upward from there is quite choppy and even unimpressive. T2108 closed today at 41%, but over the past four trading days, it has printed positive gains only in the last two days. The S&P 500 (SPY) in turn made a new 1-month low before embarking on the current meager 2-day push upward. Note in the chart below how the 50-day moving average (DMA) has steadily turned downward for all of October.
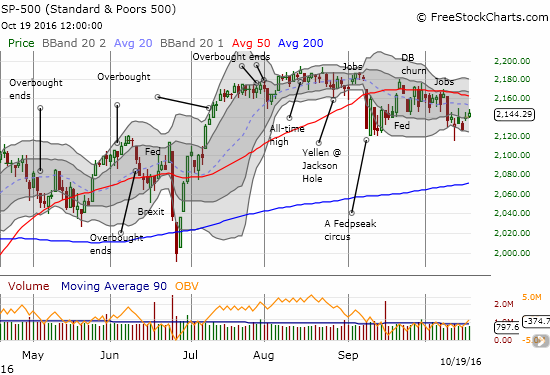
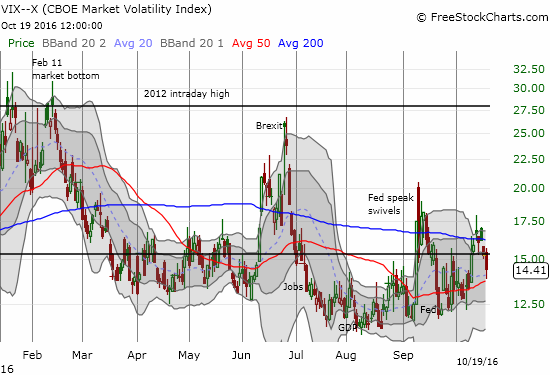
While the S&P 500 struggles, the volatility index, the VIX, has actually managed to punch its way below the 15.35 pivot line. This move takes the VIX out of the danger zone and likely sets the stage for a new trading range for the stock market…perhaps the VIX now pivots around 15.35 and/or its 50DMA.
Since this is the season for earnings, I will not over-interpret the technicals on the market. So I quickly turn my attention to some interesting charts.
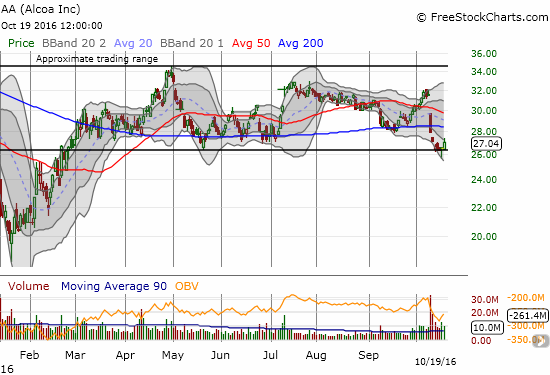
Alcoa (AA)
When I mentioned AA last week, the stock was sitting right on support at the bottom of a very extended trading range. Over the past two days, AA made a strong bid for a bottom. Buying volume was high as AA printed a hammer on Tuesday and today printed follow-through. The fade off the highs of the day that closed AA right at Friday’s high created the most notable blemish.
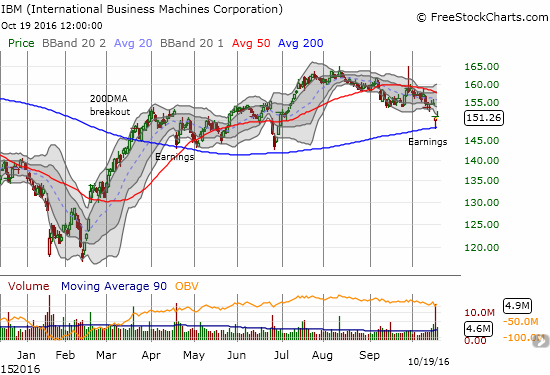
International Business Machines (IBM)
IBM was having a banner comeback year through the summer. Earnings this week may herald the end as the stock gapped down to retest 200DMA support. Technically, today IBM followed through on the hammer bottom, but the move is not convincing. I would not touch IBM on the long side until it closed above its 50DMA resistance. To the downside I would go all in short with a new post-earnings low accompanied by a 200DMA breakdown.
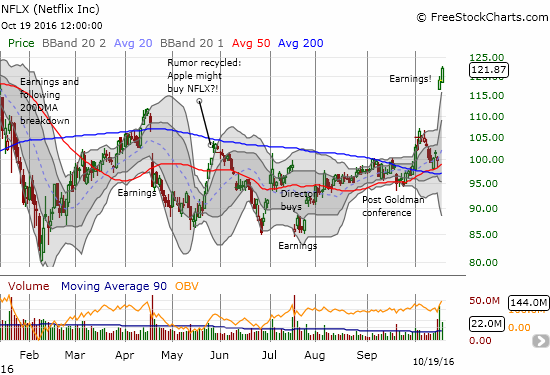
Netflix (NFLX)
No doubt about it, NFLX is back. The reaction to earnings results makes me wonder why traders and investors initially sold off NFLX after the company’s presentation at a Goldman conference last month. The stock printed a near 20% post-earnings gap up. Impressively, buyers stepped right in on day #2 despite the stock being over-extended above its upper-Bollinger Band (BB). I got caught trying to fade this move. I should not have strayed from my working strategy of playing bi-directional positions (calls and puts).
Chipotle Mexican Grill (CMG)
The trading strategy on CMG continues to work thanks to on-going bursts of volatility. Last week I bought shares and a put after CMG confirmed the latest 50DMA breakdown. I closed out the trade on Monday’s impressive follow-through selling; I assumed CMG was close enough to support that has held since June. Today, the stock burst higher by 2.9% off support. I reinitiated the trade very speculatively with a Friday expiration. I wanted to avoid the extremely high premiums for next week’s post-earnings expiration.
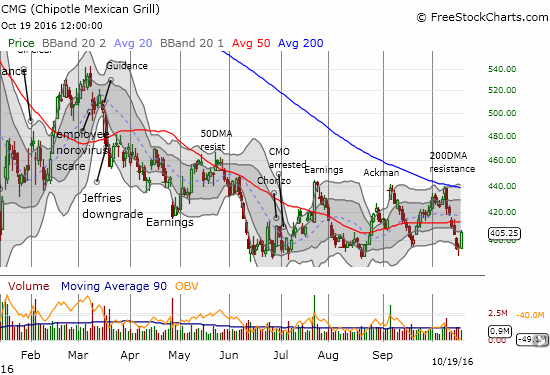
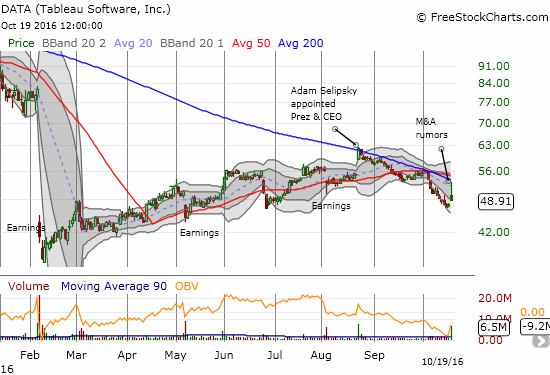
Tableau Software (DATA)
DATA is the latest tech stock to light up with M&A rumors. Hackers apparently accessed a list of potential acquisition targets eyed by Salesforce.com (CRM). I just finished calling DATA an engima of a stock last week. I thought earnings would be the next important milestone for DATA. So when I saw the big move in the wake of the M&A rumors, I quickly assessed the trading landscape.
I checked out the options trading and, strangely enough, saw very little volume in the call options around $50 across months. This lack of volume raised a red flag for me. So instead of rushing to load up on call options, I set up a conditional order to buy shares once an order for puts at bid executed. I wanted to do a hedged trade where the puts would cover losses on the shares if the current downtrend from recent highs resumed. The shares will presumably allow me to wait patiently for upside on M&A, rumored or real. Unfortunately, the trade executed in an extremely unexpected way that started the hedge at a big disadvantage. I expected the premium for puts to continue sliding faster than shares increased further on the day. However, once a rumor dropped that DATA’s attempt to sell itself stalled, the stock blasted higher and lower in the span of less than a minute. In the wake of this volatility, my buy order for the put triggered on target, BUT I did not receive shares until the stock hit near its high of the day. I ended the day with a loss on shares larger than what the put options covered.
$DATA Hearing Tableau Software's Sales Efforts Have Stalled-Dow Jones. (via bz pro)
— Ace (@Super1NYC) Oct. 19 at 12:23 PM
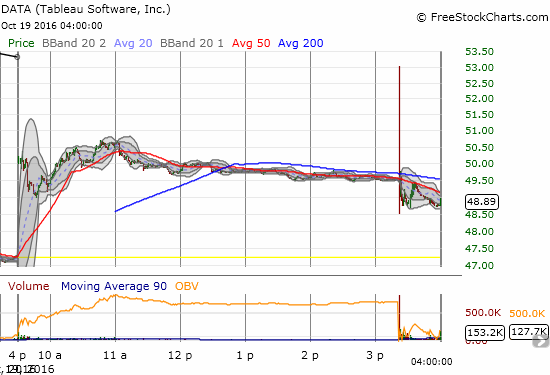
I am not sure whether there is a lesson to learn here since the situation is so bizarre. For now, I plan to keep holding for the next month through expiration.
— – —
FOLLOW Dr. Duru’s commentary on financial markets via email, StockTwits, Twitter, and even Instagram!
Daily T2108 vs the S&P 500
")
Black line: T2108 (measured on the right); Green line: S&P 500 (for comparative purposes)
Red line: T2108 Overbought (70%); Blue line: T2108 Oversold (20%)
Weekly T2108

*All charts created using freestockcharts.com unless otherwise stated
The charts above are the my LATEST updates independent of the date of this given T2108 post. For my latest T2108 post click here.
Related links:
The T2108 Resource Page
Be careful out there!
Full disclosure: long SDS, long UVXY shares and short UVXY call, long SPY call options, long CMG shares and put option, long DATA shares and put option