
(T2108 measures the percentage of stocks trading above their respective 40-day moving averages [DMAs]. It helps to identify extremes in market sentiment that are likely to reverse. To learn more about it, see my T2108 Resource Page. You can follow real-time T2108 commentary on twitter using the #T2108 hashtag. T2108-related trades and other trades are occasionally posted on twitter using the #120trade hashtag. T2107 measures the percentage of stocks trading above their respective 200DMAs)
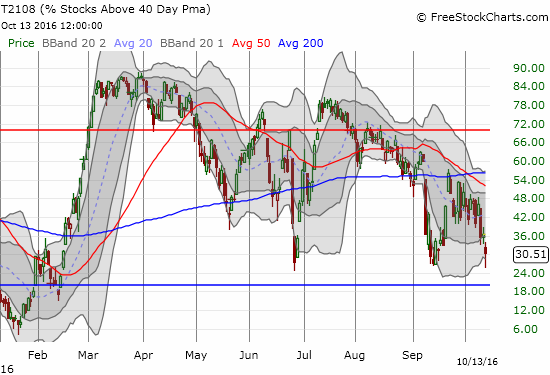
T2108 Status: 30.5%
T2107 Status: 61.9% (3-month low)
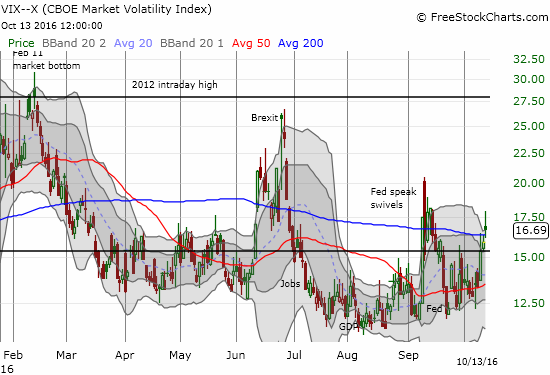
VIX Status: 16.7
General (Short-term) Trading Call: neutral
Active T2108 periods: Day #165 over 20%, Day #21 over 30% (over), Day #3 under 40% (underperiod), Day #9 under 50%, Day #25 under 60%, Day #51 under 70%
Commentary
In my last T2108 Update, I expressed reluctance to switch the short-term trading call from neutral to bearish despite the darkening clouds looming over the stock market. I think today’s trading action validated my hesitation.
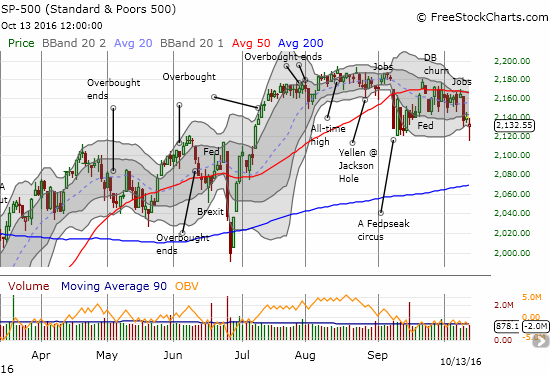
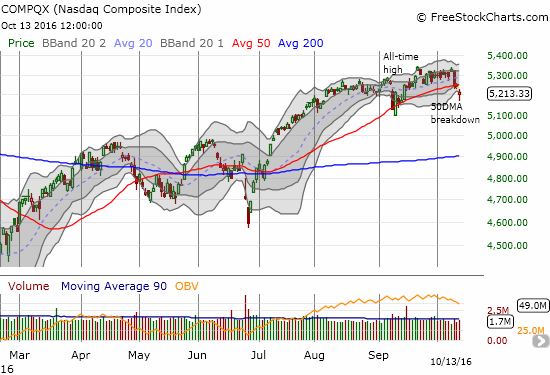
The S&P 500 and the NASDAQ both dropped below their respective lower Bollinger Bands (BBs) as sellers followed through on the previous day’s pressure. The S&P 500 retested its September low. As usual, sellers came up short: buyers were able to recover all post-open losses and a little more. These moves formed a type of bottoming hammer pattern. Now the baton goes back to buyers to prove they can follow through. If they succeed, I will assume a sustainable bottom is in place especially for the S&P 500.
T2108, the percentage of stocks trading above their respective 40DMAs, provides a good way to understand today’s action. T2108 dropped as low as 25.5%. The low just barely broke the September low and stopped short of the June (post-Brexit) low. This action brought T2108 “close enough” to oversold (20%). Similar to what I described as a possibility in the last T2108 Update, this action was “close enough” to oversold (20%) to bring in a rush of buyers. The odds of a bounce were greatly increased with the major indices trading well below their lower-BBs.
Note that buyers are not yet in the clear. The volatility index, the VIX, held onto a gain for the day and remains above the 15.35 pivot.
With T2108 dropping into the mid-20s, I grabbed a fistful of call options on QQQ and added another limit order in case T2108 managed to drop to or into oversold territory. I am saving a play on SPY call options for a play on official oversold conditions (if they occur). I locked in the profits on the QQQ calls in the middle of the bounce. I am focused on long opportunities until/unless the S&P 500 approaches/retests 50DMA resistance.
At the start of trading, media outlets blamed the selling on rate hike fears and poor data from China. The following screen capture comes from search cache:
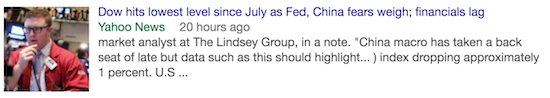
At the close, with buyers taking the baton, headlines shifted to a rise in oil as the savior of the day. For example, from CNBC: “Stocks slash earlier losses, close well off lows amid a rise in oil prices.”
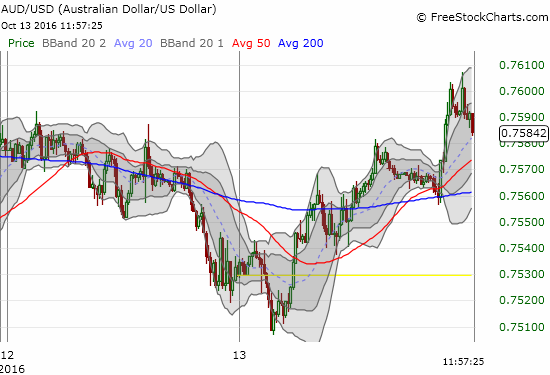
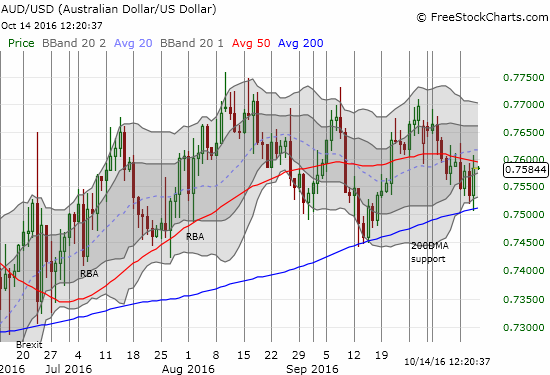
None of these explanations made much sense given action elsewhere in the market. For example, if the market really feared the poor Chinese export/import data, then the Australian dollar (FXA) should not have rallied going into the U.S. open and throughout most of it (perhaps it was a leading indicator of the coming bounce?). Australia heavily depends on exports to China. The 15-minute chart of AUD/USD shows an overnight bottom around 3am Eastern. AUD/USD was off to the races from there until 2pm Eastern. As I type, AUD/USD is taking off again as part of what has become another bounce off 200DMA (up-trending) support.
At the close of U.S. trading, the odds of a rate hike in December and subsequent months DECLINED. This drop is hardly the mark of NEW rate fears that could drive more selling. According to the CME FedWatch tool, the odds of a December hike dropped all the way from 69.5% to 65.6%.
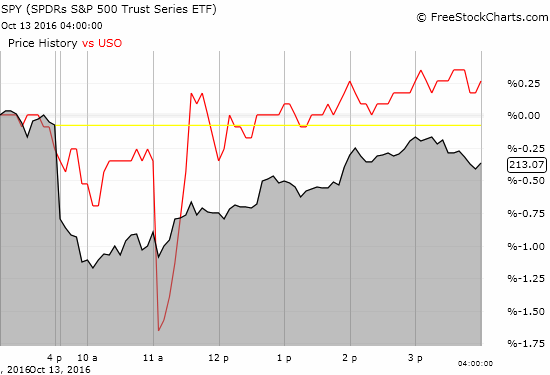
Finally, attributing the bounce to oil is essentially attributing the bounce to the closest thing within reach that is also going up. Check out this comparison of the S&P 500 and United States Oil (USO) using a 5-minute chart. I cannot tell who is following whom in this picture – not to mention USO flatlined going into the close while the S&P 500 drifted a bit downward.
Sometimes it is easier to just blame the technicals.
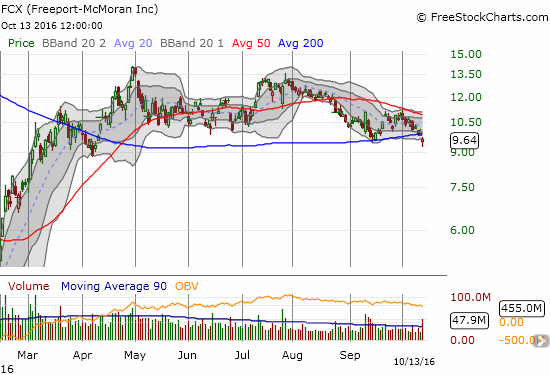
Since China and rate fears were the presumed reason for the selling, I kept checking on commodity-related names all day. Freeport-McMoRan Inc. (FCX) is of increasing interest. FCX finally closed below its 200DMA for the first time since April. More importantly, the stock is teetering at the bottom of a trading range extending to about March. Once I pull the trigger on more bullish trades, FCX will be at the top of the list as a play back to at least 50DMA resistance.
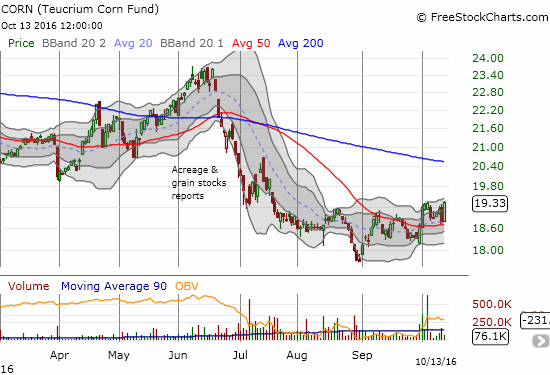
Teucrium Corn ETF (CORN) ignored all the noise of the day and rallied solidly to reverse ALL of the previous day’s gains and then some. This move almost confirmed a bottom is in place and solidified the 50DMA as support. I need to see just one more day of confirmation…
— – —
FOLLOW Dr. Duru’s commentary on financial markets via email, StockTwits, Twitter, and even Instagram!
Daily T2108 vs the S&P 500
")
Black line: T2108 (measured on the right); Green line: S&P 500 (for comparative purposes)
Red line: T2108 Overbought (70%); Blue line: T2108 Oversold (20%)
Weekly T2108

*All charts created using freestockcharts.com unless otherwise stated
The charts above are the my LATEST updates independent of the date of this given T2108 post. For my latest T2108 post click here.
Related links:
The T2108 Resource Page
Be careful out there!
Full disclosure: long SDS, long UVXY shares and short UVXY call, short AUD/USD, in hedged plays on USO