
(T2108 measures the percentage of stocks trading above their respective 40-day moving averages [DMAs]. It helps to identify extremes in market sentiment that are likely to reverse. To learn more about it, see my T2108 Resource Page. You can follow real-time T2108 commentary on twitter using the #T2108 hashtag. T2108-related trades and other trades are occasionally posted on twitter using the #120trade hashtag. T2107 measures the percentage of stocks trading above their respective 200DMAs)
T2108 Status: 67.1%
T2107 Status: 72.9%
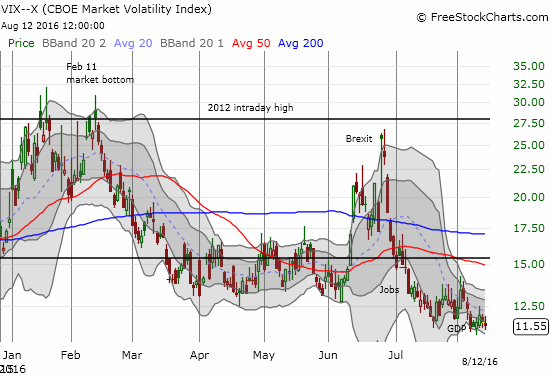
VIX Status: 11.56 (2-year low)
General (Short-term) Trading Call: neutral
Active T2108 periods: Day #127 over 20%, Day #33 over 30%, Day #32 over 40%, Day #31 over 50%, Day #8 over 60% (overperiod), Day #10 under 70%
Commentary
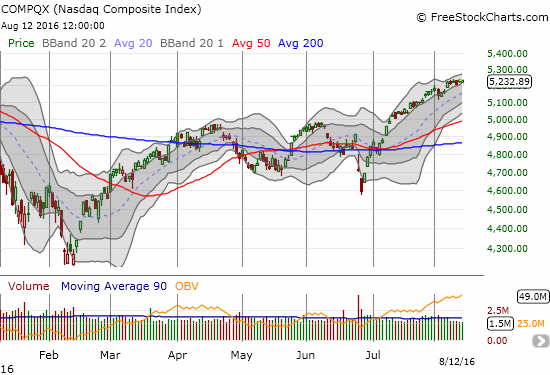
Last week was a week of boring all-time highs. After the previous Friday’s all-time high, the S&P 500 (SPY) made two new intraday highs and one new closing high. The new closing high came on a day when all three major indices – the S&P 500, the NASDAQ (QQQ), and the Down Jones Industrials – hit new all-time highs on the same day for the first time since 1999 (at least Nightly Business Report made that observation). Yet, the S&P 500 barely gained a point for the week.
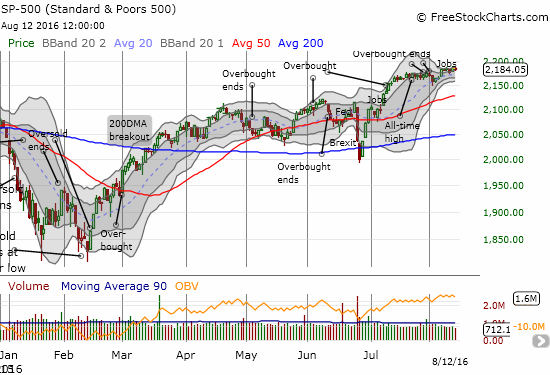
Despite the new all-time highs, T2108, the percentage of stocks trading above their respective 40-day moving averages (DMAs), has yet to return to overbought status. It was last overbought on July 29th for a brief 1-day overbought period. This divergence is not dramatic, but it DOES have my attention given I am already wary about the extremely low level of the volatility index, the VIX, during a period prone to big drawdowns.
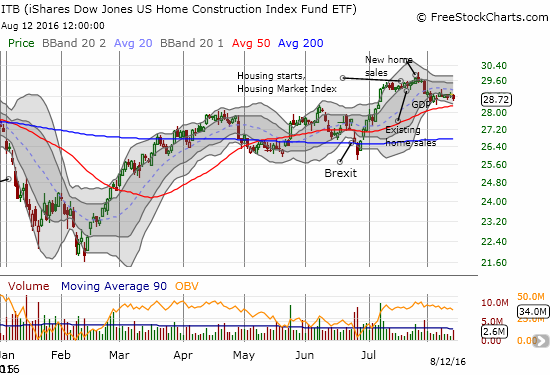
Another surprising divergence was the ability of the S&P 500 to gain on a day when US Q2 GDP printed with a supposedly disappointing number while the iShares US Home Construction (ITB) took a dive it has yet to even try to reverse.
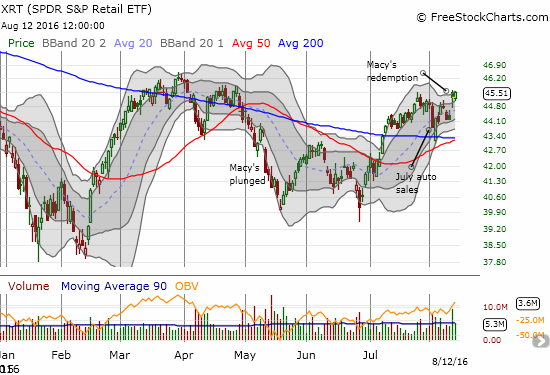
On the positive side, last week was the “revenge of retail.” Retail was downright explosive, and surprisingly so given the boring gyrations on the major indices. Earlier in the week, I decided to double-down on my bet against SPDR S&P Retail ETF (XRT) with more puts. By the end of the week, I got the message and bought a call spread on Nordstrom (JWN) ahead of the company’s earnings on Friday. I was both relieved and amazed to see JWN manage to gap up 8.0% even after already rallying strongly into earnings in sympathy with Macy’s (M) and Kohl’s (KSS). JWN was the icing on the cake of a week that completely changed the tone for retail. (I have to think if the market is ready to get bullish on retail again, homebuilders must have another surge coming soon?).
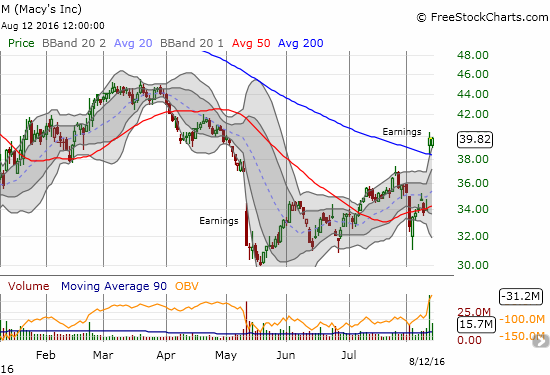
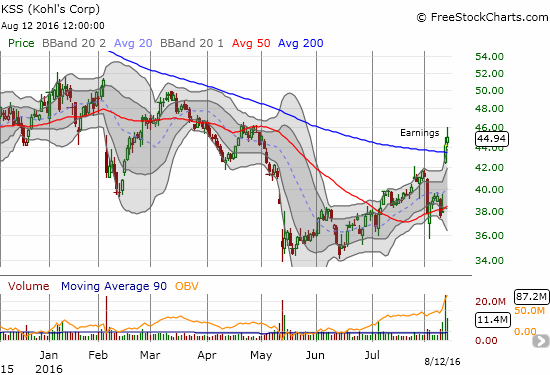
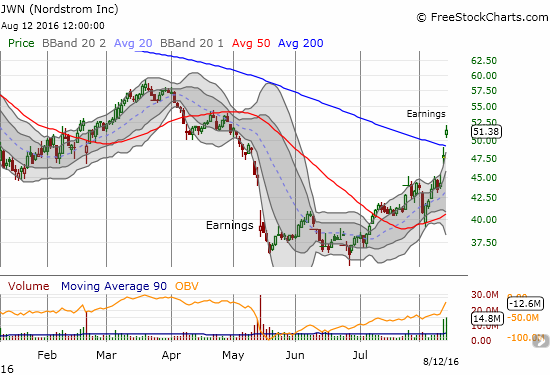
Notice ALL three of these retailers made bullish 200DMA breakouts – talk about a definitive and coordinated change of tone!
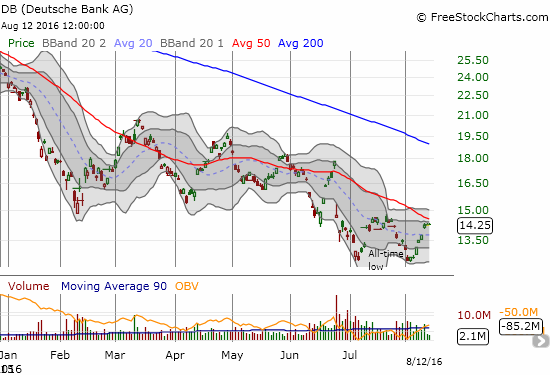
My short-term trading call is still neutral, so I continue looking for bearish trades to complement bullish ones. As I promised in an earlier post, I faded Deutsche Bank (DB) with put options on the current rally into 50DMA resistance.
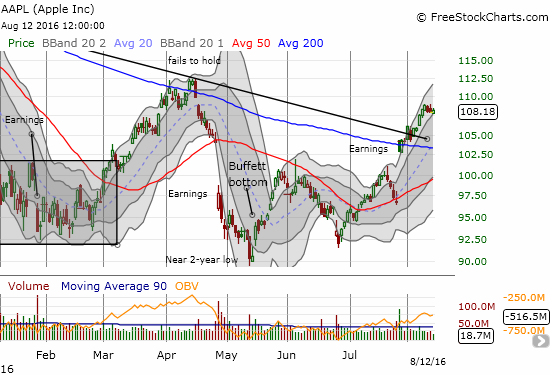
Also as promised I returned to Apple (AAPL) with a two week position. The first week delivered profits right from the start but by the end of the week my call options returned to flat. Still, the stock looks poised for another burst higher. As long as my trading call is not bearish on the market, I am going to have a bias to play AAPL to the bullish side.
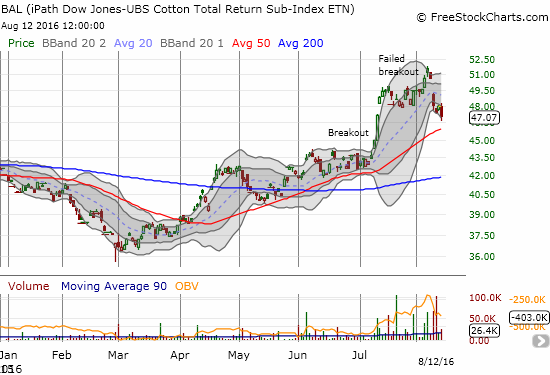
Finally, I experienced some setbacks in the commodity space. The breakout in iPath Bloomberg Cotton SubTR ETN (BAL) took a stumble. I am next looking for the 50DMA to confirm itself as support…otherwise, I will need to exit my position.
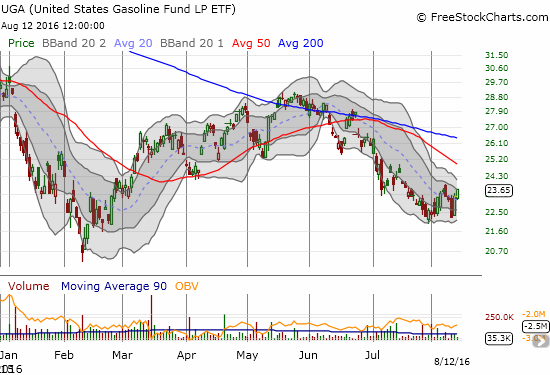
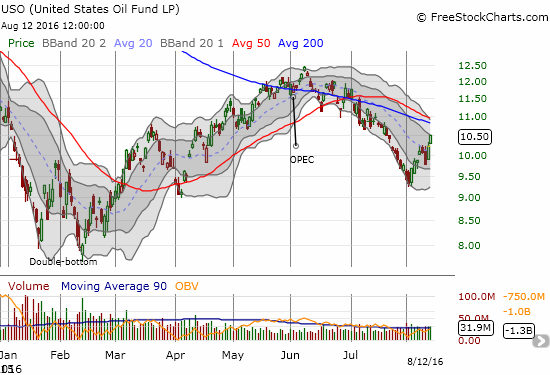
I launched into the pairs trade on gasoline versus oil that I described in Revisiting Trading United States Oil Versus Gasoline ETFs. My timing proved overeager! The UGA/USO ratio declined right after I established the position. More importantly, on two separate days, UGA declined while USO gained, exactly the scenario I noted to be very rare. Since I am long UGA and short USO (with put options), these inverse moves exactly delivered my worst case scenario!
— – —
Reference Charts (click for view of last 6 months from Stockcharts.com):
S&2016-08-12;P 500 or SPY
U.S. Dollar Index (U.S. dollar)
EEM (iShares MSCI Emerging Markets)
VIX (volatility index)
VXX (iPath S&P 500 VIX Short-Term Futures ETN)
EWG (iShares MSCI Germany Index Fund)
CAT (Caterpillar).
IBB (iShares Nasdaq Biotechnology).
Daily T2108 vs the S&P 500
")
Black line: T2108 (measured on the right); Green line: S&P 500 (for comparative purposes)
Red line: T2108 Overbought (70%); Blue line: T2108 Oversold (20%)
Weekly T2108

*All charts created using freestockcharts.com unless otherwise stated
The charts above are the my LATEST updates independent of the date of this given T2108 post. For my latest T2108 post click here.
Related links:
The T2108 Resource Page
Be careful out there!
Full disclosure: long SSO put options, long SDS, long BAL, long DB put options, hedged play on USO as well as a pairs trade long UGA shares vs USO puts, long AAPL call options, long XRT put options, long KSS, long JWN call spread