
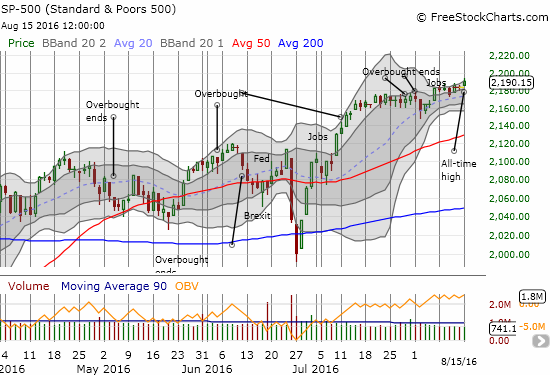
On Monday, August 15, 2016, Nightly Business Report (NBR) started its daily broadcast by noting another triple of all-time highs across the major indices – the S&P 500 (SPY), the NASDAQ (QQQ), and the Dow Jones Industrials (DIA).
From there, NBR marveled at what it called the calmest market in 75 years. The reporting was not as precise as I would have liked, but I gathered that NBR used some analysis based on four weeks of trading at a time.
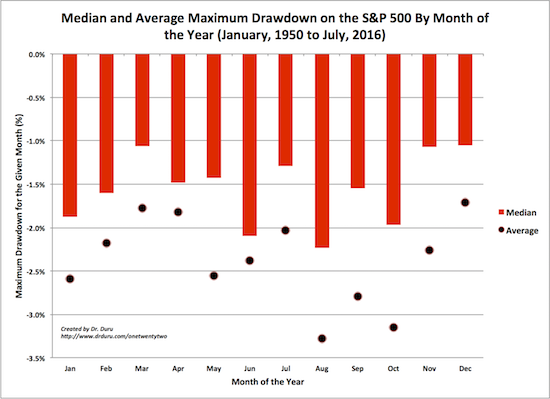
In all but 2 days in the last 4 weeks, the S&P 500 has gained or lost less than 0.5% (absolute value for those of you who want to be technically correct). I assume this means that there is not another 4 week period with so few days of larger moves until 1941. This streak is pretty remarkable, but it comes without context – like when was the last 4 week period with only 3 days of gains or losses more than 0.5%, the last 4 week period with only 4 days, etc… Anticipating the conventional assumption that summer is a time of low-volume, lazy trading, NBR noted that August typically features “erratic trading” and is one of the weakest months of the year. I was surprised NBR leaned on this explanation since we are only halfway through the month; there is plenty of time to see more typical August-like behavior.
NBR offered the following explanations for the current lack of volatility. This list looks like something aggregated and collected from a variety of (unnamed) analysts and related market experts. I include my own editorial:
- Post-Brexit selling was overdone. Me: Presumably this event shook out sellers – something I have speculated about in an earlier post.
- U.S. economic data brightened significantly. Me: This claim completely ignores the poor Q2 GDP number that rattled currencies and bonds but not the S&P 500. The S&P 500 DID pullback in the wake of weak auto sales for one of the two days with a move outside the current +/-0.5% range.
- Companies surpassed earnings forecasts.
- Confidence that Fed would not lift rates soon. Government bond yields at or near record lows support stock markets. Me: And yet, this confidence in a paralyzed Fed and the supportive nature of low rates ignores that both conditions are in place specifically because of weak economic conditions – which of course brings us right back to the ironic contradictions in claim #2 above.
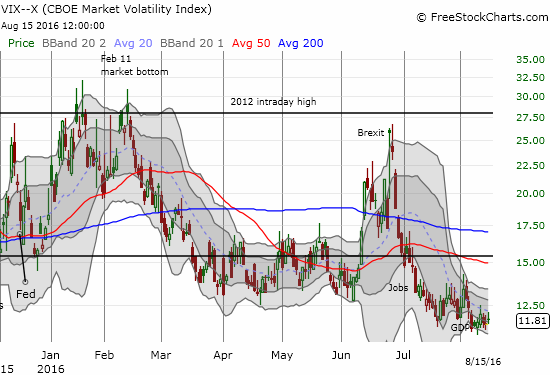
In other words, even backing into an explanation for the market’s behavior is a difficult task full of contradictions, conundrums, and outright mysteries. The following explanation in a separate NBR piece works just as well as any: the bears are are growling a lot and biting little…
“‘The market is being driven by the same theme,’ said Bruce Bittles, chief investment strategist at Baird, referring to low interest rates around the world and the ‘hunt for yield.’ ‘Until we get some optimism, the path of least resistance is higher. Nobody likes this market.'”
Be careful out there!
Full disclosure: long SDS shares, long UVXY shares and puts, long SVXY puts