
A little over a year ago, I recommended a pairs trade going long United States Gasoline (UGA) versus going short the United States Oil (USO). I never did take up that trade, instead choosing to focus on my (still on-going) hedged trade on USO. Looking back, I wish I had gone ahead and setup the trade.
At the time, I recommended waiting for the UGA/USO ratio to pull back given the extremely sharp run-up at the time. The ratio managed to spike a little further before collapsing as most hyper-extended moves do. I should have executed the trade at that point. It looks like a similar opportunity has opened up.
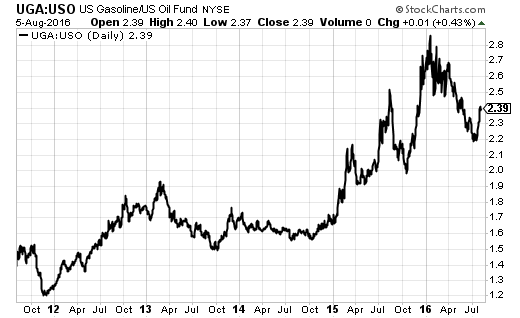
Source: StockCharts.com
Since I remain committed to my hedged USO position, my UGA versus USO will be an overlapping trade. The options on UGA are thinly traded and illiquid, so I will go long shares and pair them against USO put options dated for April, 2017. Based on recent history, an 8-month runway should provide plenty of time for my profitable scenarios to play out. My optimistic target assumes that UGA/USO is on an uptrend that will cross 3.0 in the “near future.” This implies roughly a 25% upside performance from UGA over USO.
If I target an optimistic peg at $30 by next April, that gives a 27% upside opportunity in UGA itself. Pairing that against put options on USO expiring in April gives me the $9 strike priced at $0.82/1.00, hopefully I can get a $.90 fill. To cover the cost of these puts, I need 15 shares of UGA for every put of USO. This ratio is my baseline minimum.
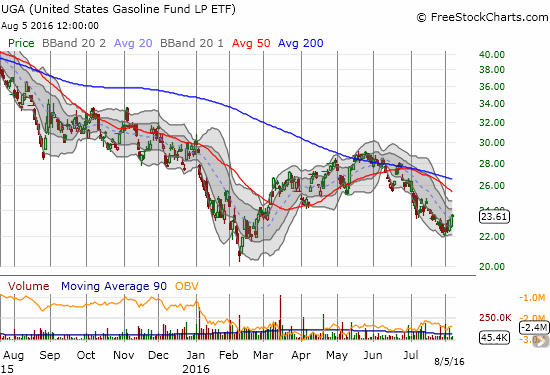
Source: FreeStockCharts.com
Given I am buying shares on UGA, I have to be particularly mindful of managing the downside risk. So when UGA is in decline, I prefer that the UGA/USO ratio plunge at the same time – my baseline expectation of an uptrend for UGA/USO suggests such a plunge form current levels will not happen anytime soon. My worst case scenario is a rally in oil and a sell-off in gasoline. Fortunately, this scenario is rare and has not happened in an any extended form in recent years at least.
On the downside, I peg USO to retest this year’s double-bottom at $8.00/share. If I wait for USO to drop to that point by April, my put options will expire at break-even and I will likely have a loss on UGA. The current delta on the USO April $8 put options is 0.32. Without taking into account gamma (0.12) and theta (-0.002), this means a one-point loss on USO in the “near future” will generate a 37% (0.32/0.90) profit on the USO put options. A quick drop to $8 for USO, which is a 19% loss, generates $61 in profit for each option purchased. If UGA also loses 19% ($4.5/share from current levels), then I need 1 USO put for about each 14 shares of UGA to break-even.
So, for both my upside and downside scenario a ratio of 15 shares of UGA for each USO put should keep me at breakeven. Since I expect 27% out-performance of UGA along the way, this ratio should generate profits somewhere along the way from the current ratio toward 3.0. That is, if USO and UGA resume a sell-off from current levels, the gains in the puts should outpace the loss on the shares. If USO and UGA continue to rally form current levels, the gains in shares should outpace the loss on the puts. Of course, my calculations are rough estimates, and I may need to adjust the trade as reality unfolds.
I plan to execute this trade sometime in the coming week. (I will post the specific timing to my twitter feed with the hashtag #122trade and list it in my T2108 Update)
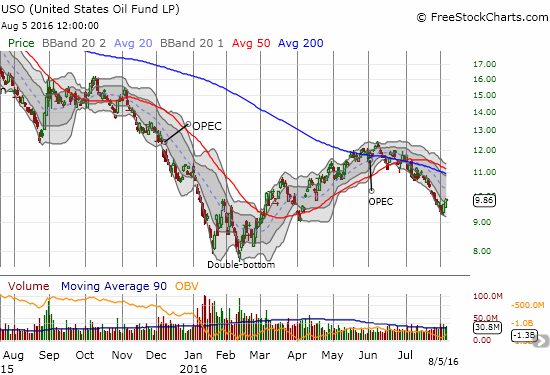
Source: FreeStockCharts.com
Be careful out there!
Full disclosure: holding a hedged position on USO