
(This is an excerpt from an article I originally published on Seeking Alpha on May 31, 2016. Click here to read the entire piece.)
At the beginning of this month, I claimed an unwind of confidently long positions was imminent for the Australian dollar. {snip}
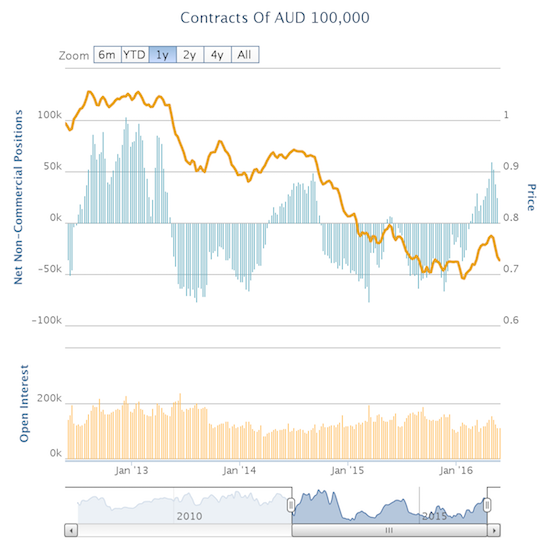
Source: Oanda’s CFTC’s Commitments of Traders
{snip}
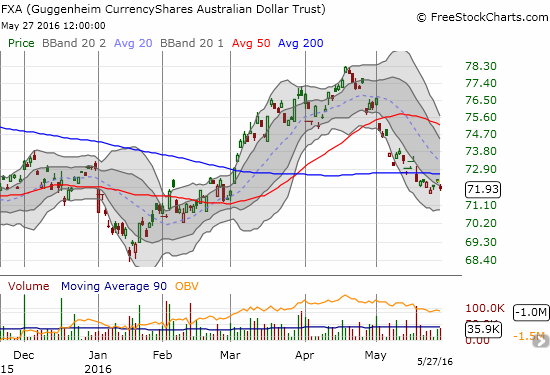
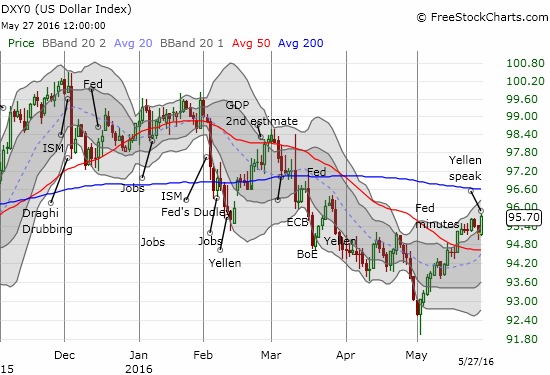
Source: FreeStockCharts.com
At the end of April, I anticipated an unwind in confidently long positions for the Japanese yen (FXY). {snip}
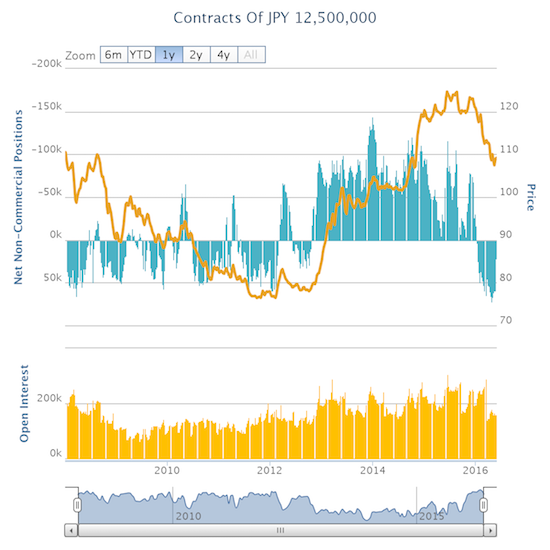
Source: Oanda’s CFTC’s Commitments of Traders
{snip}
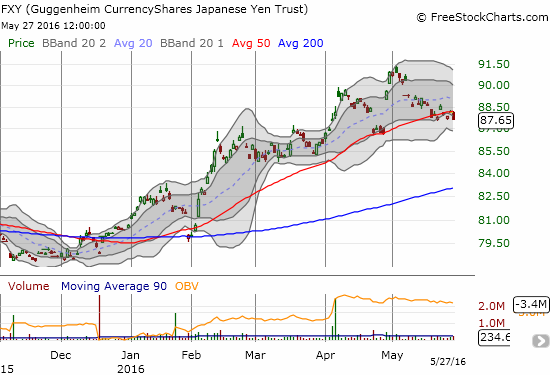
Source: FreeStockCharts.com
The Australian dollar and the Japanese yen are just two examples of several that demonstrate a change of sentiment and positioning in currency markets. It is as if summer is bringing a season of discontent with the positioning that dominated the first part of this year.
The U.S. dollar index (UUP) has been much maligned for most of 2016; the index was in decline as defined by its 50DMA downtrend until a major breakout May 18th. {snip} The market has responded to the Fed’s urgings. The Fed will deliver its next rate hike in July assuming it maintains its current strategy and pattern of giving the market exactly what the Fed has convinced it to expect. In other words, the Fed coaches the market well in advance of its moves in order to avoid disruptive surprises. As a result, I am assuming the dollar index printed a bottom in May that will last at least through a July Fed rate hike.
(Around 4:15 mark in the video, the host gave Yellen an opportunity to give money managers the info they needed before clearing out their offices for the Hamptons)
Source: FreeStockCharts.com
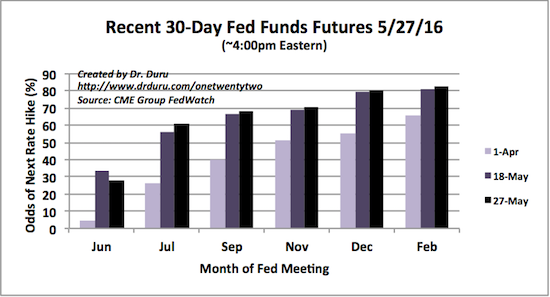
Source: CME Group’s FedWatch
Just as May was pivotal for changing the directional bias for the U.S. dollar, the positional discontent has cascaded out to gold and silver as well. {snip}
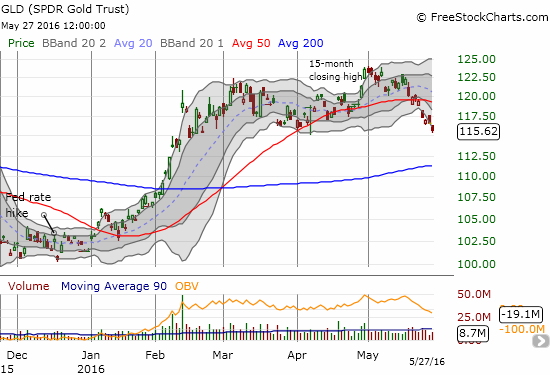
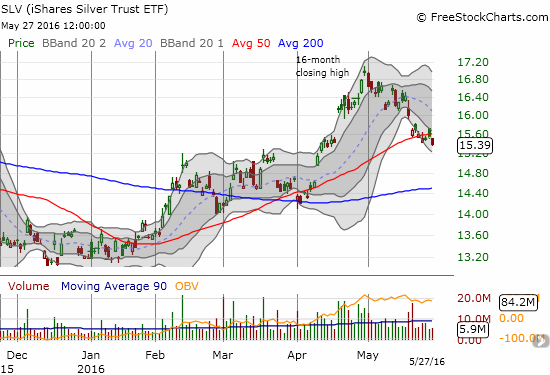
Source: FreeStockCharts.com
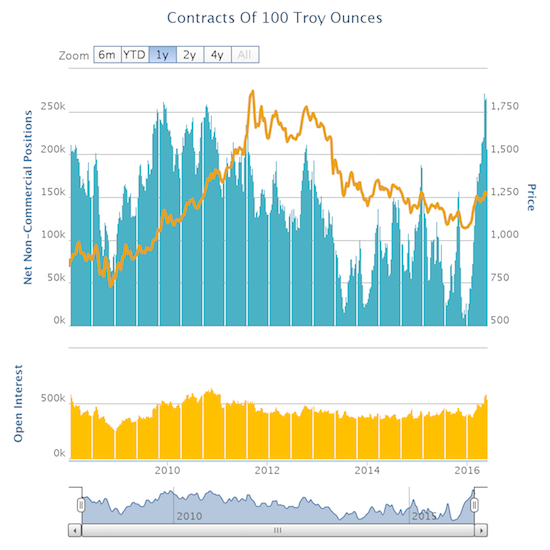
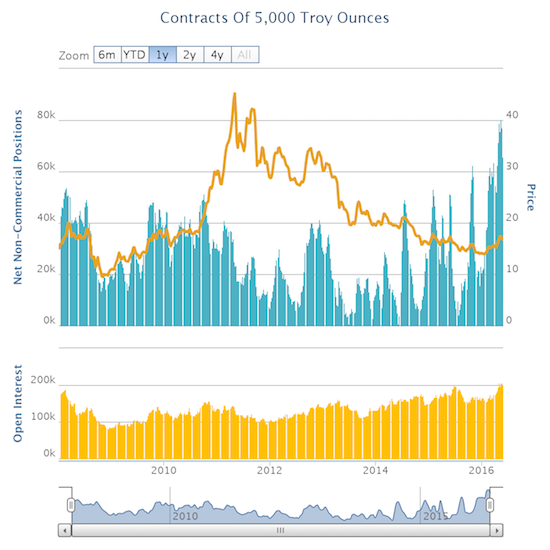
Source: Oanda’s CFTC’s Commitments of Traders
Of course, a new catalyst can always come along and rekindle interest in gold and silver. When I used Google Trends to claim that gold had not yet experienced a blow-off top, I relied on continued strength in interest in silver and 30-Day Fed Fund Futures as supporting casts to my assessment. Those catalysts dramatically changed in less than three weeks. If a new set of catalysts arrive, I do not expect them to arrive until after the Fed’s July rate hike. {snip}
{snip}
Be careful out there!
Full disclosure: long GLD, SLV, net short the Australian dollar, net short the Japanese yen
(This is an excerpt from an article I originally published on Seeking Alpha on May 31, 2016. Click here to read the entire piece.)