
(This is an excerpt from an article I originally published on Seeking Alpha on May 8, 2016. Click here to read the entire piece.)
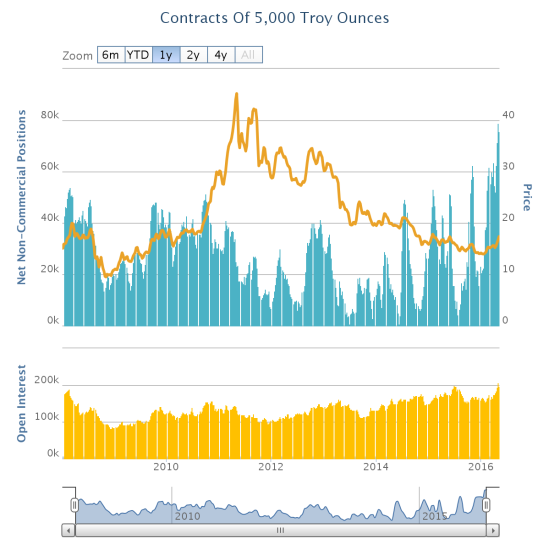
Speculators are now net long gold at levels that surpass the financial crisis of 2008/2009 and the major 2011 peak in gold prices.
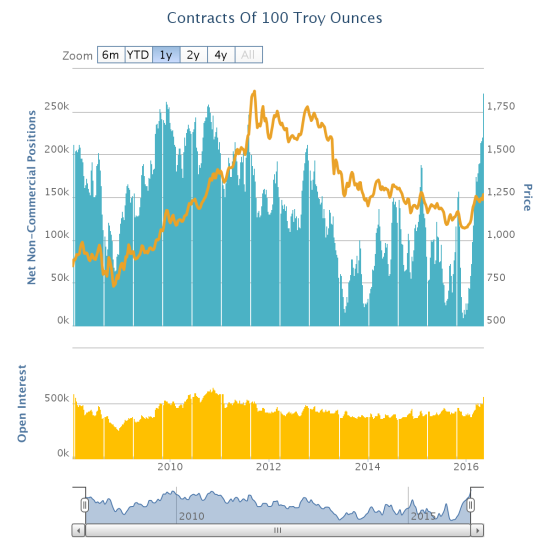
Source: Oanda’s CFTC’s Commitments of Traders
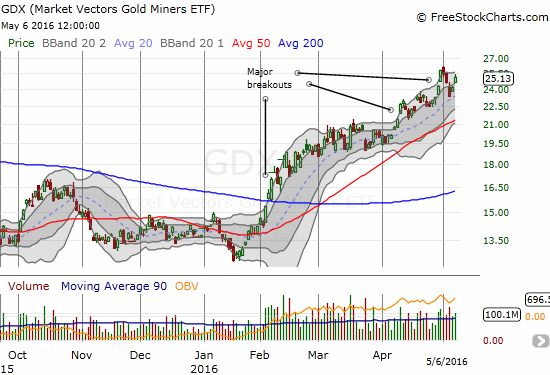
Given this surge, I expected to see a fresh, major run-up in SPDR Gold Shares (GLD). Instead, GLD spent most of the week rolling back some of the breakout that occurred at the end of April.
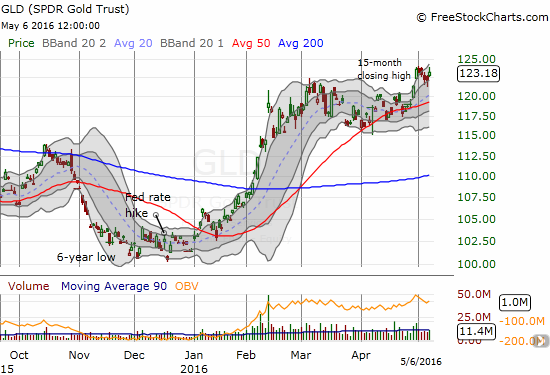
Source: FreeStockCharts.com
Next, I turned to my favorite indicator of gold sentiment: Google Trends. {snip}
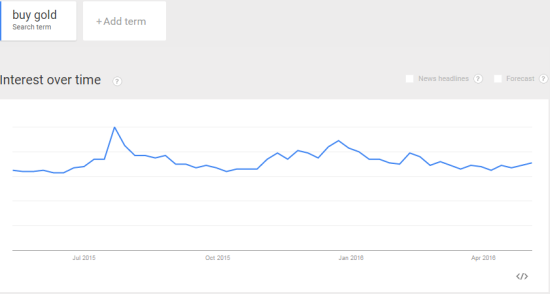
Source: Google Trends
Although Google Trends has not responded to the current trading extremes for gold, I fully expect a response in due time. {snip}
One reason gold buyers have remained bold is the waning credibility of the Fed on “rate normalization.” For many months now, the 30-Day Fed Fund futures have mostly left odds for the next rate hike late in 2006, sometimes off into 2017. {snip}
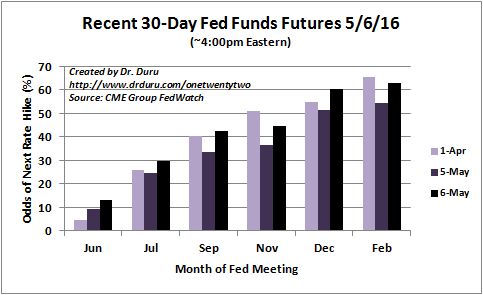
Source: CME FedWatch Tool
The market’s skepticism about rate normalization has also come through in the persistent slide in the U.S. dollar (UUP). {snip}
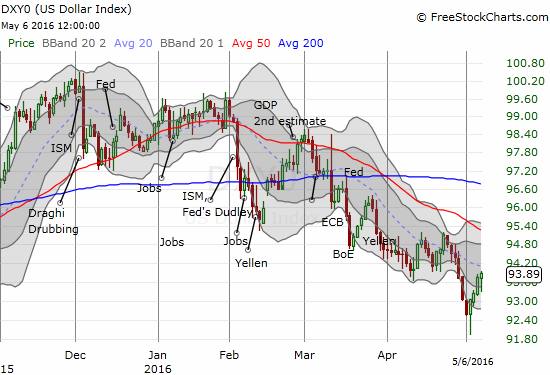
Source: FreeStockCharts.com
Trader confidence in the dollar’s decline has come through in the near one-way bets against the dollar across most major currencies. Recently, however, I have seen hints that a great unwind may be looming for the Japanese yen (FXY) and the Australian dollar (FXA) {snip}
Overall, my trading approach on gold remains the same. {snip}
Source: FreeStockCharts.com
I also dabbled in silver which I saw as itching to catch-up to gold’s run. {snip}
Source: CME FedWatch Tool
Be careful out there!
Full disclosure: long GLD, long and short various currencies versus the U.S. dollar
(This is an excerpt from an article I originally published on Seeking Alpha on May 8, 2016. Click here to read the entire piece.)