
(T2108 measures the percentage of stocks trading above their respective 40-day moving averages [DMAs]. It helps to identify extremes in market sentiment that are likely to reverse. To learn more about it, see my T2108 Resource Page. You can follow real-time T2108 commentary on twitter using the #T2108 hashtag. T2108-related trades and other trades are occasionally posted on twitter using the #120trade hashtag. T2107 measures the percentage of stocks trading above their respective 200DMAs)
T2108 Status: 65.7%
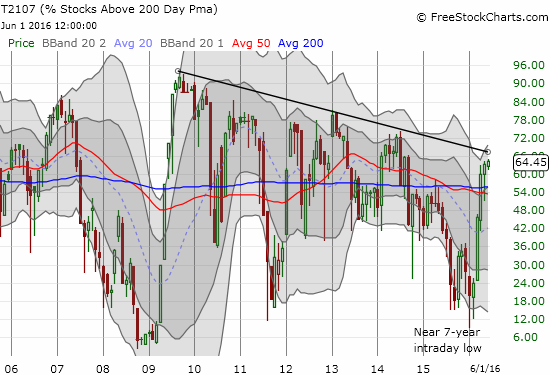
T2107 Status: 64.5%
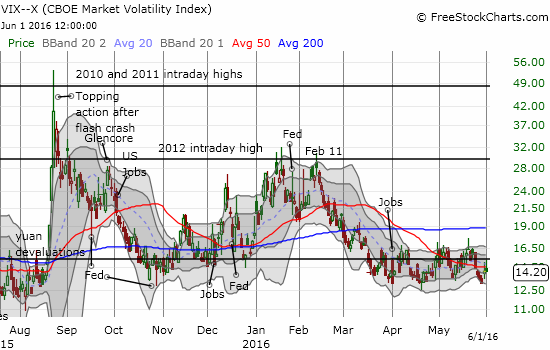
VIX Status: 14.2
General (Short-term) Trading Call: cautiously bullish
Active T2108 periods: Day #76 over 20%, Day #75 over 30%, Day #72 over 40%, Day #6 over 50%, Day #5 over 60% (overperiod), Day #21 under 70% (underperiod)
Commentary
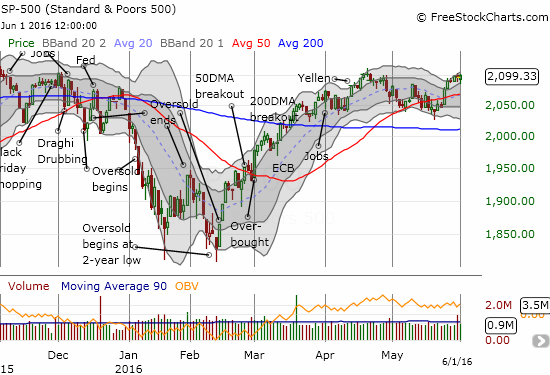
The general stock market is moving in slow motion. The S&P 500 (SPY) has closed just below the 2100 mark for three straight days.
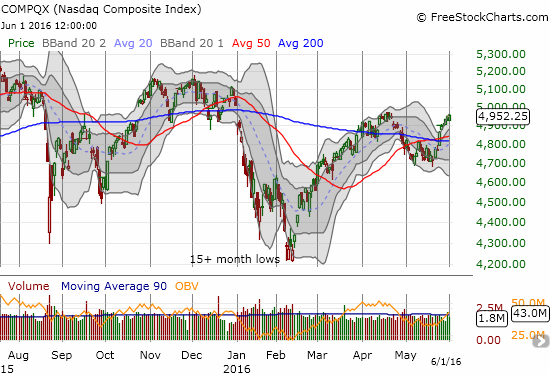
The NASDAQ (QQQ) has fared a little better although its jet-packed momentum from mid-May has slowed down a bit.
I suspect the market is generally waiting for the outcome of the May U.S. jobs report. This report comes out on Friday, June 3rd and could confirm a July rate hike from the Fed. I do not know how to map out the market’s potential reaction because the current rally started with the release of the minutes of the last Fed meeting. These minutes essentially confirmed that the Fed is itching and ready to raise interest rates again. If the market is truly getting comfortable with the prospect of an imminent rate hike, then a poor jobs report may actually be interpreted as bad.
The volatility index inched upward this week. The move is barely worth mention except to point out that the recent lows once again failed to maintain a grip on the VIX for long.
T2108 closed at 65.7%. It is inching ever more closely to overbought status. T2107, the percentage of stocks trading above their 200DMAs, hit a new 21-month high at 64.5%. T2107 is getting ever closer to a downtrend line that has held since 2009. While the new high is very bullish, I am still cautious because T2107 will need to break this multi-year downtrend in order to release the S&P 500 to new (all-time) heights.
While we wait for the jobs report to resolve the market’s next steps, here are a few charts of interest.
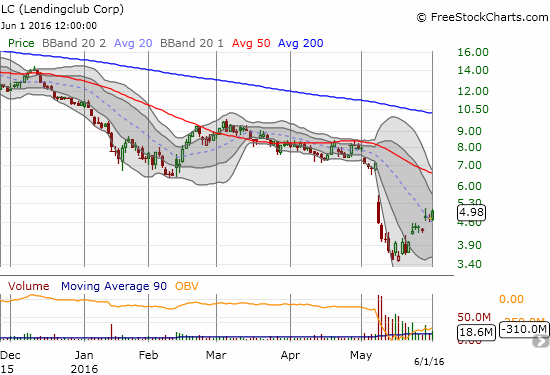
LendingClub Corporation (LC) has run into a major buzzsaw of scandal and questionable practices. However, the company appears to be on the road to cleaning house and repair. The stock chart shows a potential bottom with two high-volume gap ups from a small consolidation at the all-time low.
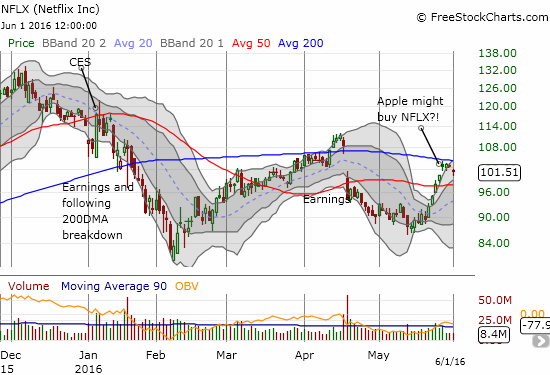
Netflix (NFLX) finally ran out of some steam as its 200-day moving average (DMA) holds firm as resistance.
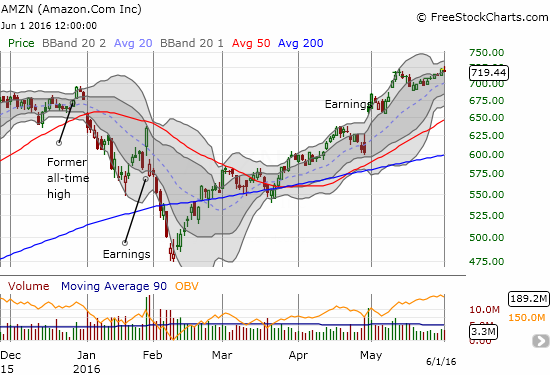
Amazon.com (AMZN) made a new intra-day all-time high but pulled back. Adding to my sense of caution is trading volume: volume is shrinking on this straight-line rally from the May 19th low. This is a very critical juncture for AMZN.
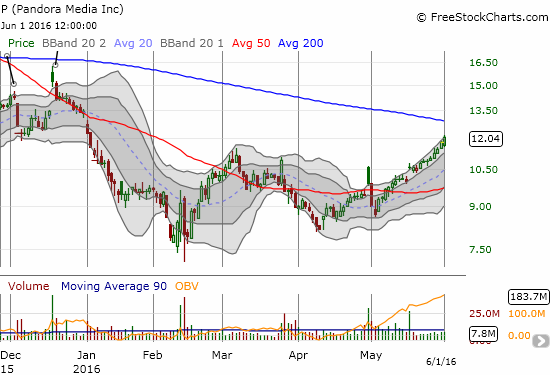
Speaking of straight lines, Pandora (P) has quietly gained almost every single day since a quick post-earnings sell-off that started the month of May. I finally started building a position today – I am very late to the game so I already have a plan to add to my position on lower prices. I basically have on a “no regret” position right now in case Pandora never delivers a buyable dip.
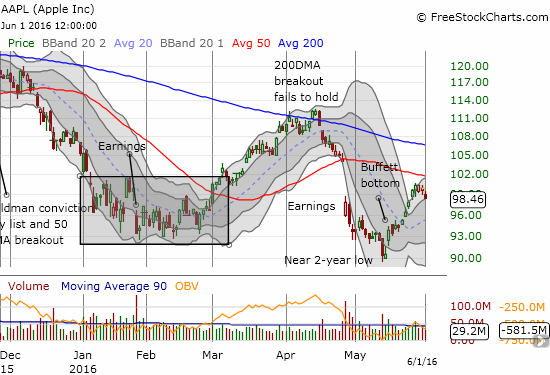
Apple (AAPL) enjoyed a Buffett afterglow to hit $100. Like clockwork, sellers showed up at magic number resistance. The stock still sits comfortably in an uptrend from its recent multi-year lows; the upper-Bollinger Bands (BB) now define this trend. AAPL may now need a new catalyst to get over what looks like formidable resistance at its declining 50DMA.
— – —
Reference Charts (click for view of last 6 months from Stockcharts.com):
S&P 500 or SPY
U.S. Dollar Index (U.S. dollar)
EEM (iShares MSCI Emerging Markets)
VIX (volatility index)
VXX (iPath S&P 500 VIX Short-Term Futures ETN)
EWG (iShares MSCI Germany Index Fund)
CAT (Caterpillar).
IBB (iShares Nasdaq Biotechnology).
Daily T2108 vs the S&P 500
")
Black line: T2108 (measured on the right); Green line: S&P 500 (for comparative purposes)
Red line: T2108 Overbought (70%); Blue line: T2108 Oversold (20%)
Weekly T2108

*All charts created using freestockcharts.com unless otherwise stated
The charts above are the my LATEST updates independent of the date of this given T2108 post. For my latest T2108 post click here.
Related links:
The T2108 Resource Page
Expanded daily chart of T2108 versus the S&P 500
Expanded weekly chart of T2108
Be careful out there!
Full disclosure: long NFLX put options, long SSO call options, long P call options