
(T2108 measures the percentage of stocks trading above their respective 40-day moving averages [DMAs]. It helps to identify extremes in market sentiment that are likely to reverse. To learn more about it, see my T2108 Resource Page. You can follow real-time T2108 commentary on twitter using the #T2108 hashtag. T2108-related trades and other trades are occasionally posted on twitter using the #120trade hashtag. T2107 measures the percentage of stocks trading above their respective 200DMAs)
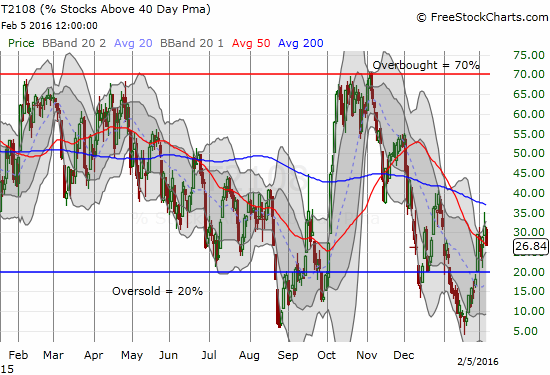
T2108 Status: 26.8%
T2107 Status: 16.2%
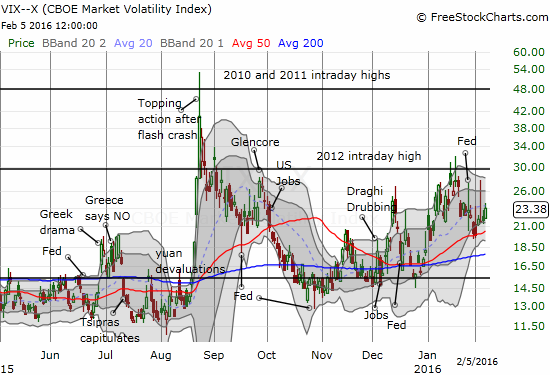
VIX Status: 23.4
General (Short-term) Trading Call: bullish
Active T2108 periods: Day #6 over 20% (overperiod), Day #24 under 30% (underperiod), Day #40 under 40%, Day #44 below 50%, Day #59 under 60%, Day #400 under 70%
Commentary
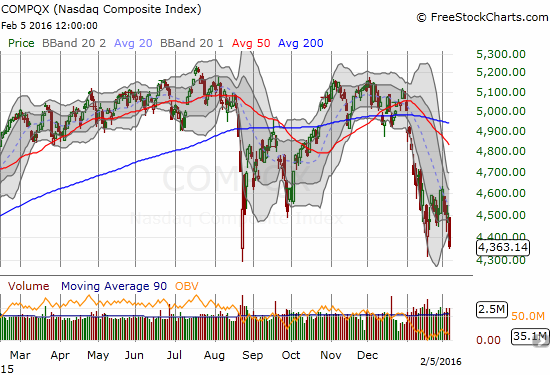
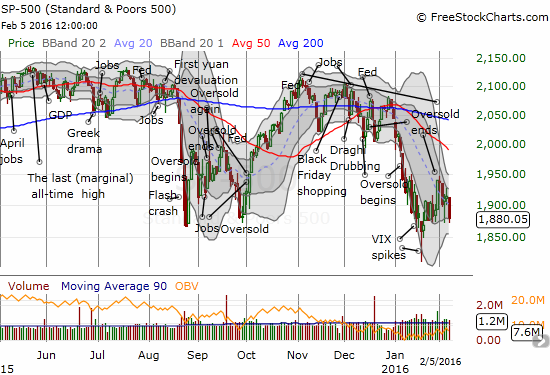
The bad news is that tech stocks and growth stocks in general got crushed on Friday, February 5, 2016. The good news is that T2108, the percentage of stocks trading above their respective 40-day moving averages (DMAs), hung in there for the day and barely reflected the carnage in tech. In other words, the broader market has not yet broken down like tech stocks have in the past week. In between the good and the bad news hangs my prediction and expectation that the S&P 500 (SPY) will hit resistance at its overhead 50DMA before dropping into oversold conditions yet again. That prediction is looking a little more precarious.
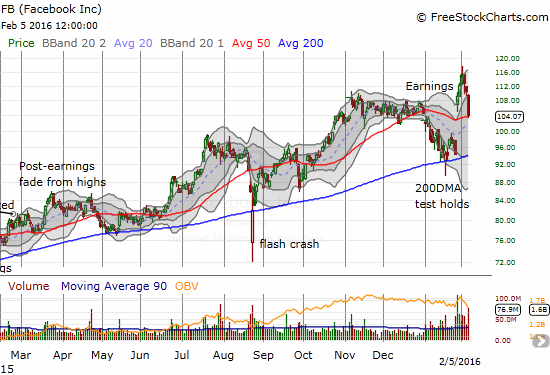
The relative resilience of T2108 suggests that the broader market is still hanging in there even as the (former) leaders of the indices are stumbling. And my are they stumbling. They are becoming the new fallen ones. Facebook (FB) is doing its best to drop from “full bull” status with three days of high-volume selling that has reversed all its incremental post-earnings gains. FB now faces a critical retest of 50DMA support.
Google (GOOG)? Forget about it. Not only did GOOG quickly erase ALL its post-earnings gains that sent the stock to a fresh all-time high, but also it sliced through 50DMA support like butter. With a fresh closing low for 2016, GOOG is once again on the edge of filling the post-earnings gap up from October. Support at its 200DMA is also in play. I placed a limit order on Friday that got filled near the close….{gulp}.

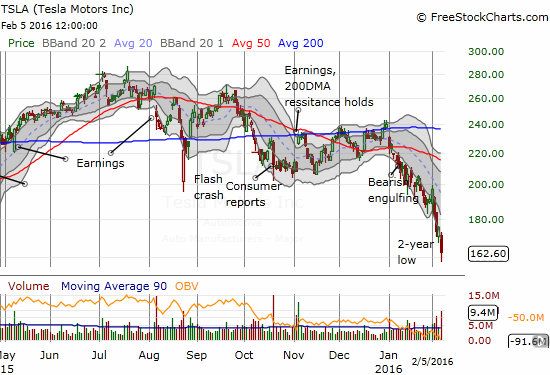
I have not posted about Tesla (TSLA) since I pointed out the very bearish 50DMA breakdown early in January. I also dared not trade TSLA from the bearish side because I assumed it would be one of the first stocks to enjoy a sharp relief rally whenever the market popped out of its funk. Instead, TSLA has traded nearly straight down ever since and is now at a 2-year low. TSLA is no longer teflon and could even be losing its cult-like appeal. Earnings on February 10th after-market should provide a key tell for residual commitment to TSLA.
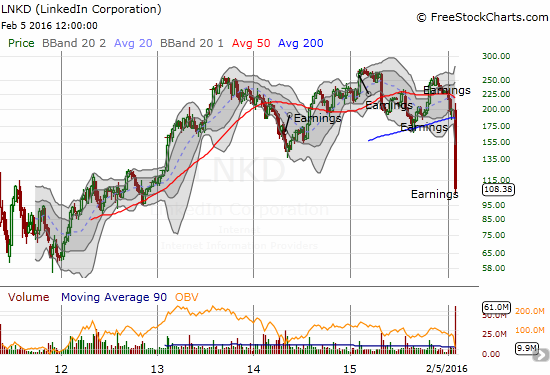
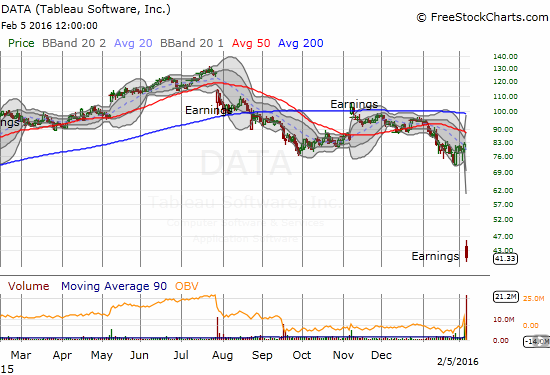
There were two significant earnings-related collapses that completely blew me away. These ring out like loud alarm bells for all growth and other (former) momentum-type stocks. LinkedIn (LNKD), a former trading favorite of mine, dropped a gut-wrenching 43%. Tableau (DATA), a stock I assumed would be on the mend after its next earnings report, collapsed a whopping 49%. These types of massive one-day drops of well-known names with good, solid businesses are extremely rare. So, they have my attention big-time.
As readers know, I like buying stocks which drpo well below lower-Bollinger Bands (BBs). THESE drops were no-brainers to try. I was able to flip LNKD call options for a day trade, and I still have the stock on my buy list for swing trades this week. I also want to believe that over the longer-haul LinkedIn is just fine.
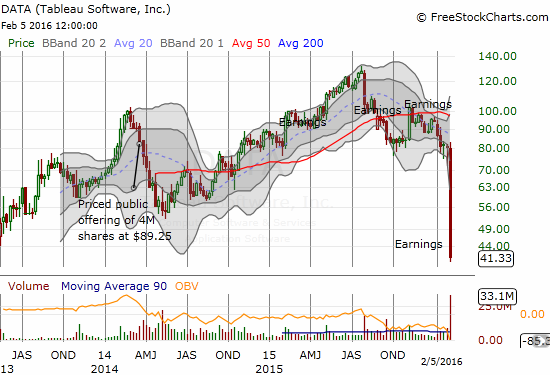
I was not as fortunate with DATA. First of all, I had a pre-earnings call spread going that completely blew up on me. Ironically, I preferred to buy shares and put options as a hedge, but I thought the put options were too expensive. Silly me! My hedged bullish position would have turned into huge profits with this kind of decline. Post-earnings, I bought shares rather than call options, but DATA lost a little more going into the close.

@BullBear_DD @nitehawk @TraderMike – so I assume poor EPS guide and OK rev guide means slash (expensive) prices to push volume? $DATA
— Duru A (@DrDuru) Feb. 4 at 02:19 PM
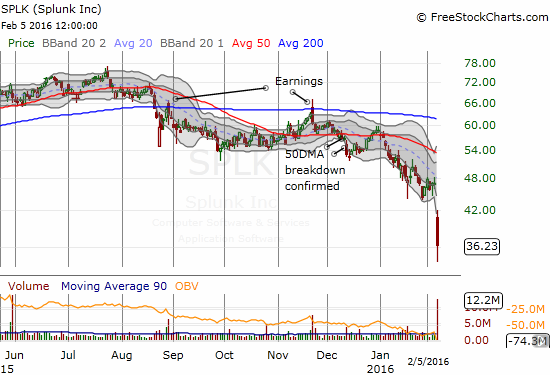
Splunk (SPLK) dropped in sympathy with DATA. Again, I cannot even remember when I last saw a stock drop this much in sympathy with an industry peer’s bad news. While I have long been bearish on SPLK, I did not have a short position going at the time. This drop was deep enough to make me try to play a bounce from here. Nerves will certainly be running thin when the company reports on February 25th after-market. For now, I am assuming DATA suffered some company-specific issues that are likely competitive in nature. So, I am looking for excuses to finally get bullish on SPLK.
Like T2108, the volatility index, the VIX, did not move as much as I would have expected given the carnage in tech stocks. This kind of divergence is a slight positive, BUT the VIX seems to have confirmed 50DMA support and a growing uptrend from the last lows.
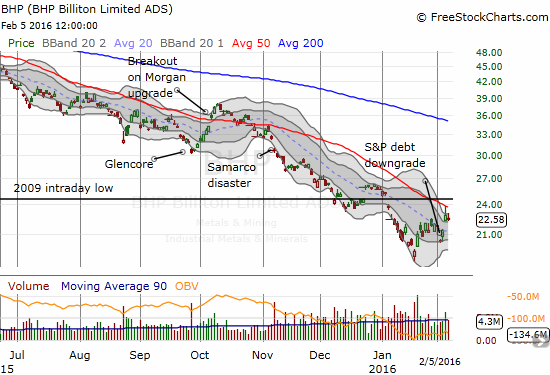
While growth and momentum stocks have received a pounding, money SEEMS to be rotating over to the truly beaten up stocks in cyclicals, especially commodity-related. I believe this rotation will be short-lived. I used this opportunity to double down on my favorite hedge against bullishness, Caterpillar (CAT), and to reload put options on BHP Billiton Limited (BHP). These stocks could have an additional tailwind or at least respite this week given the slowdown of economic activity and reporting for the Chinese New Year.

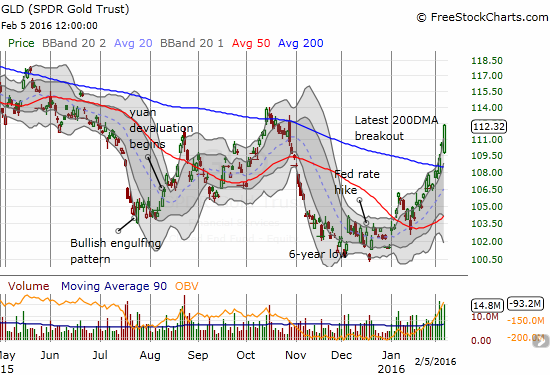
Amid all this doom and gloom, gold continues to sneak its way higher. Perhaps traders are running to gold for a “safe haven.” I think safe havens are just temporary refuges for false hopes. I can better accept GLD as a bet or hedge against the U.S. dollar. SPDR Gold Shares (GLD) experienced strong buying volume: 2.3x the 3-month average. The current 200DMA breakout is the strongest and most impressive since January, 2015 when the Swiss National Bank capitulated on its currency floor against the euro. GLD now needs to break above the last highs (set in October) to get a breakout from the current downtrend.
— – —
For readers interested in reviewing my trading rules for T2108, please see my post in the wake of the August Angst, “How To Profit From An EPIC Oversold Period“, and/or review my T2108 Resource Page.
Reference Charts (click for view of last 6 months from Stockcharts.com):
S&P 500 or SPY
U.S. Dollar Index (U.S. dollar)
EEM (iShares MSCI Emerging Markets)
VIX (volatility index)
VXX (iPath S&P 500 VIX Short-Term Futures ETN)
EWG (iShares MSCI Germany Index Fund)
CAT (Caterpillar).
IBB (iShares Nasdaq Biotechnology).
Daily T2108 vs the S&P 500
")
Black line: T2108 (measured on the right); Green line: S&P 500 (for comparative purposes)
Red line: T2108 Overbought (70%); Blue line: T2108 Oversold (20%)
Weekly T2108

*All charts created using freestockcharts.com unless otherwise stated
The charts above are the my LATEST updates independent of the date of this given T2108 post. For my latest T2108 post click here.
Related links:
The T2108 Resource Page
Expanded daily chart of T2108 versus the S&P 500
Expanded weekly chart of T2108
Be careful out there!
Full disclosure: long SSO call options, long SSO shares, long SVXY shares, short UVXY puts, long CAT puts, long FB calls and short shares, net long the U.S. dollar, long GLD, long DATA, long GOOG call options
This may be the retest of the Jan. 20 lows that I was expecting.
But certainly we could crash through those lows, putting T2108 back into single digits. That’s what I’m looking for as a buy point. And not all at once of course….
Tensions are definitely extremely high. But we have Janet Yellen coming up this week just in time to try to calm everyone down again.