
(T2108 measures the percentage of stocks trading above their respective 40-day moving averages [DMAs]. It helps to identify extremes in market sentiment that are likely to reverse. To learn more about it, see my T2108 Resource Page. You can follow real-time T2108 commentary on twitter using the #T2108 hashtag. T2108-related trades and other trades are occasionally posted on twitter using the #120trade hashtag. T2107 measures the percentage of stocks trading above their respective 200DMAs)
T2108 Status: 18.1% (as high as 19.4%)
T2107 Status: 15.3%
VIX Status: 22.4
General (Short-term) Trading Call: bullish
Active T2108 periods: Day #15 under 20%, Day #18 under 30%, Day #34 under 40%, Day #38 below 50%, Day #53 under 60%, Day #394 under 70%
Commentary
“Full bull” is a term I used to apply to stocks that I targeted for aggressively bullish trading. I think I can also apply it to Facebook (FB) which happens to have a very relevant ticker symbol.
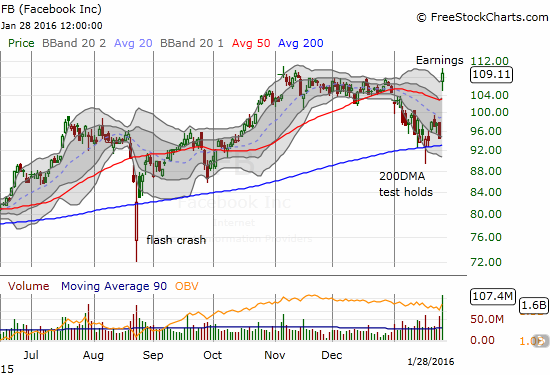
FB is now a poster child for “full bull” because it easily survived its test of support at its 200-day moving average (DMA) and followed that up with a stellar post-earnings performance. A fresh all-time high would have earned the triple crown. With 107.4M shares trading hands – a whopping 4x the current 3-month average – buyers have returned in force, and I expect all this momentum to lead to more all-time highs in the near future. This will be a stock to aggressively buy on the dips for swing trades.
Ironically, FB was my last standing short (hedge) for this oversold period. I used the recent selling to eliminate all the other shorts and hedges. I made a very bad execution error by failing to grab some call options to protect against just this kind of move. However, recognizing the bullishness of this move, I immediately loaded up on call options soon after the post-earnings open. To my surprise, they all sold at their price targets before the close of trading (they were $109 and $110 calls expiring next Friday).
While the sparks were flying in FB trading, the S&P 500 spent the day churning in a very tight range that aligns with the tight range now in place for a fifth straight trading day.
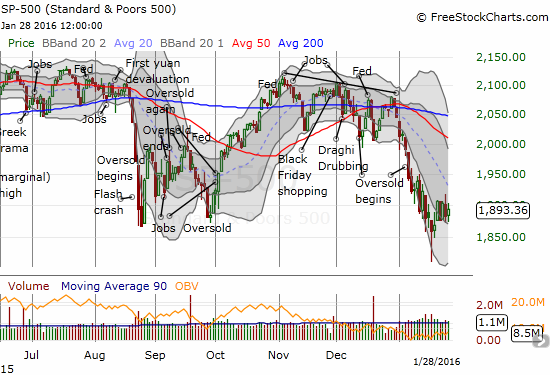
Only T2108, the percentage of stocks trading above their respective 40-day moving averages (DMAs), reveals that action is simmering under the surface. The first 30 minutes of the trading day, T2108 rocketed right to the edge of the oversold threshold (20%). It quickly collapsed from there into the gap created by the open before pulling off a steady recovery into the close. The contours of this move matched the trading in the S&P 500. It was a quick tease peering over the edge of the oversold period. This oversold period has lasted 15 days. This duration puts this oversold period in the “historic” category. Since 1987, only FIVE oversold periods have lasted longer.
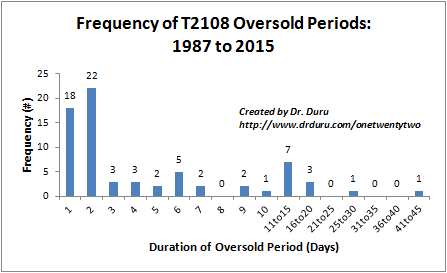
This is a critical moment for bulls and buyers. My projection for a 25-day oversold period based on the number of single digit T2108 oversold days implies that the market will at best completely stall out for the next two weeks. I am still assuming that even if the oversold period comes to an end well before the 25-day projection, another oversold period will quickly follow.
So, while I welled up with anticipation after getting to peer over the edge of this extended and historic oversold period, I can easily identify all the technical damage that remains and in some cases continues to worsen. For example, two recent trades in Hortownworks (HDP) and Atlassian Corporation (TEAM) which looked good for one brilliant day have already succumbed to fresh all-time lows. I am holding on only because of my rule against selling in an oversold period.
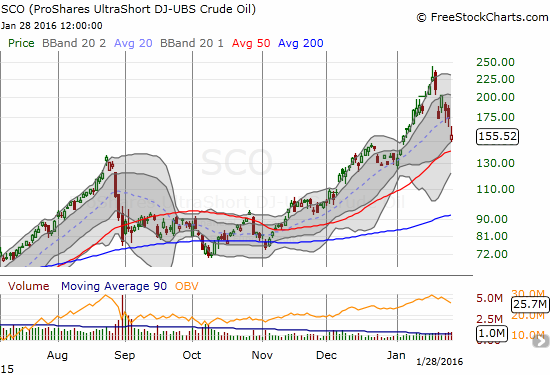
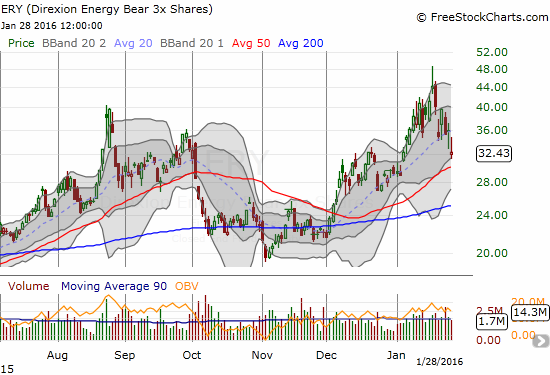
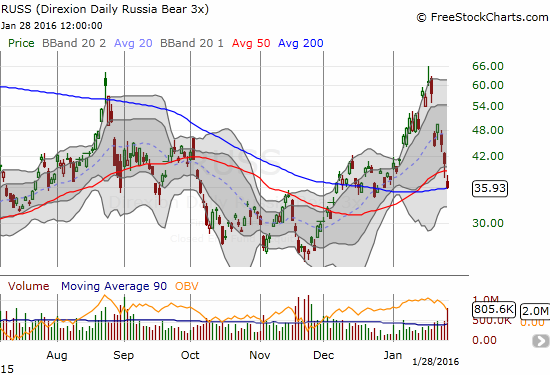
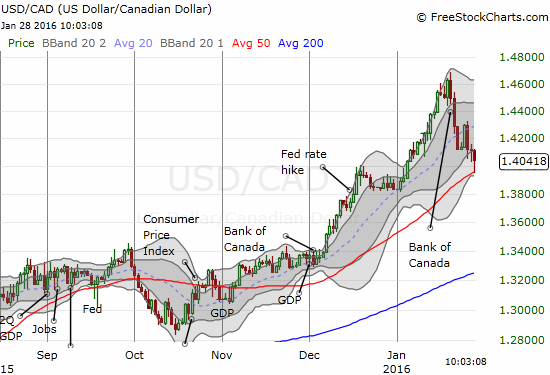
If the tides turn negative again from here, I will first look to the oil-related trades. My call for a bottom in United States Oil (USO) is working out very well so far but some kind of pullback could be due. USO is already up 18% from last week’s intraday all-time low. The bearish oil-related plays are all coming to important tests of uptrending support at 50 and 200DMAs: ProShares UltraShort Bloomberg Crude Oil (SCO), Direxion Daily Energy Bear 3X ETF (ERY), Direxion Daily Russia Bear 3X ETF (RUSS). Watching these trendlines helped me make a timely call to go long ERY in early January. Even the Canadian dollar (FXC) is testing similar support in USD/CAD. I will be ever more focused on these trades for short-term moves in (early) February.
— – —
For readers interested in reviewing my trading rules for T2108, please see my post in the wake of the August Angst, “How To Profit From An EPIC Oversold Period“, and/or review my T2108 Resource Page.
Reference Charts (click for view of last 6 months from Stockcharts.com):
S&P 500 or SPY
U.S. Dollar Index (U.S. dollar)
EEM (iShares MSCI Emerging Markets)
VIX (volatility index)
VXX (iPath S&P 500 VIX Short-Term Futures ETN)
EWG (iShares MSCI Germany Index Fund)
CAT (Caterpillar).
IBB (iShares Nasdaq Biotechnology).
Daily T2108 vs the S&P 500
")
Black line: T2108 (measured on the right); Green line: S&P 500 (for comparative purposes)
Red line: T2108 Overbought (70%); Blue line: T2108 Oversold (20%)
Weekly T2108

*All charts created using freestockcharts.com unless otherwise stated
The charts above are the my LATEST updates independent of the date of this given T2108 post. For my latest T2108 post click here.
Related links:
The T2108 Resource Page
Expanded daily chart of T2108 versus the S&P 500
Expanded weekly chart of T2108
Be careful out there!
Full disclosure: long SSO call options, long SSO shares, long TEAM, long HDP, short FB