
(T2108 measures the percentage of stocks trading above their respective 40-day moving averages [DMAs]. It helps to identify extremes in market sentiment that are likely to reverse. To learn more about it, see my T2108 Resource Page. You can follow real-time T2108 commentary on twitter using the #T2108 hashtag. T2108-related trades and other trades are occasionally posted on twitter using the #120trade hashtag. T2107 measures the percentage of stocks trading above their respective 200DMAs)
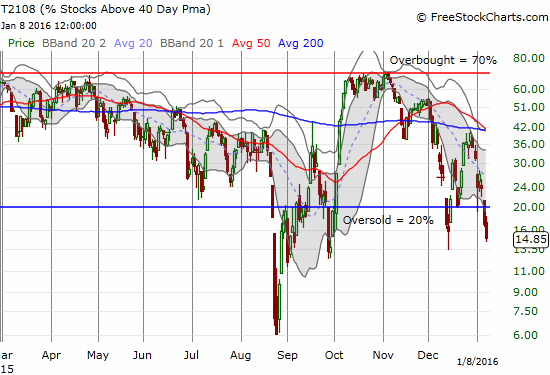
T2108 Status: 14.9%
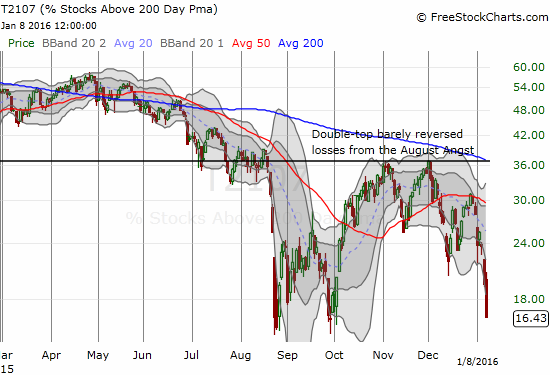
T2107 Status: 16.4%
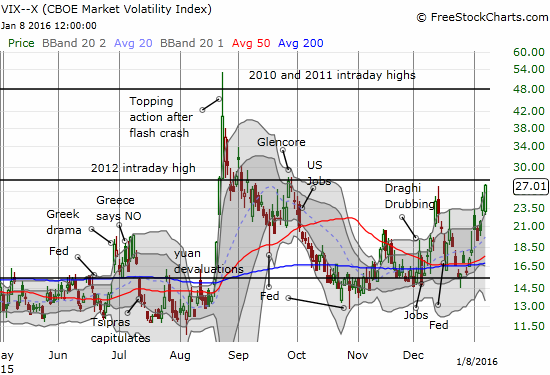
VIX Status: 27.0 (an elevated close last seen September, 2015)
General (Short-term) Trading Call: bullish with a “short leash”
Active T2108 periods: Day #2 under 20%, Day #5 under 30%, Day #21 under 40%, Day #25 below 50%, Day #40 under 60%, Day #381 under 70%
Reference Charts (click for view of last 6 months from Stockcharts.com):
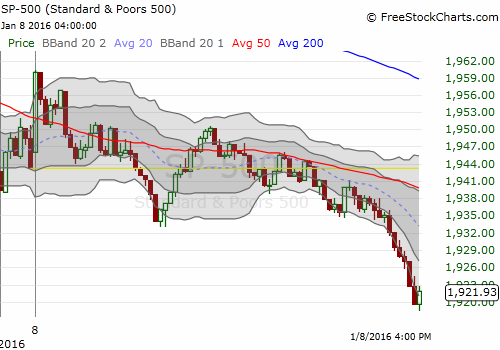
S&P 500 or SPY
SDS (ProShares UltraShort S&P500)
U.S. Dollar Index (volatility index)
EEM (iShares MSCI Emerging Markets)
VIX (volatility index)
VXX (iPath S&P 500 VIX Short-Term Futures ETN)
EWG (iShares MSCI Germany Index Fund)
CAT (Caterpillar).
IBB (iShares Nasdaq Biotechnology).
Commentary
Between the shutdown of China’s stock market circuit breakers and the U.S. jobs report, the market somehow found some relief. The relief lasted for about the first 5 minutes of U.S. trading.
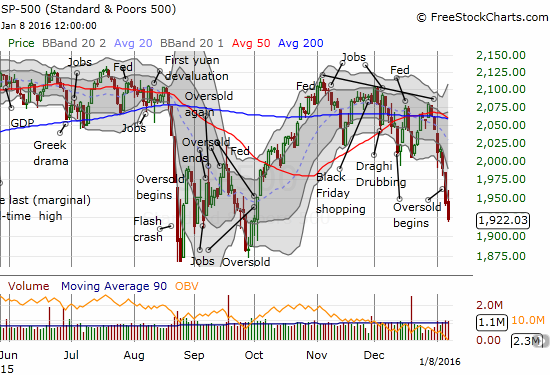
The selling drove T2108, the percentage of stocks trading above their respective 40-day moving averages (DMAs), to a new 3+ closing low at 14.9%. This is the second day of the oversold period (T2108<20%). For this phase of selling the percentage of stocks trading above their respective 200DMAs, T2107, becomes of great interest. T2107 also closed at a new 3+ closing low. However, THIS low formed a double bottom during the serious of oversold periods that marked the August Angst. For now, I am not expecting this low to break...at least not before another relief bounce from oversold trading conditions.
With oversold conditions stretching, I am surprised the VIX, the volatility index, is not even higher than it is. Instead, the VIX closed just below the 2012 intraday high. Could the VIX fail exactly where the last oversold period in December failed?
The oversold period is now deep enough for me to get a lot more bullish: I moved my trading call from bullish with a very short leash to bullish with just a short leash. Given the quickly deteriorating technicals of the S&P 500, I am guessing a first upside target at the first lower-Bollinger Band (BB) makes sense. However, T2108 may not even exit oversold territory at that point, so my most optimistic target for now is the rapidly declining 20DMA.
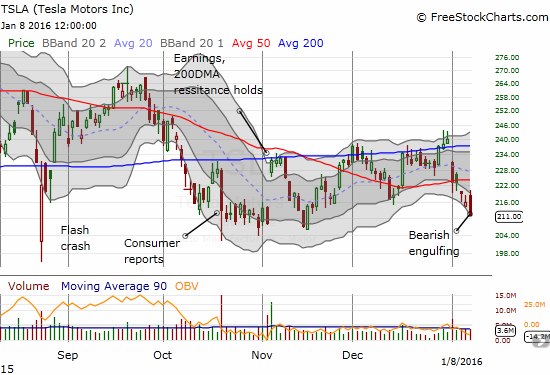
In-line with my trading call, I released more short positions. This is where things get VERY uncomfortable for me and my positioning. One bearish position I sold was omy put options on Tesla Motors (TSLA). This turned into a 2-day holding; I figured time would quickly work against me with a week to go before expiration. Ironically, even as I closed it out near the close, the move TSLA printed is a confirmation of the earlier 50DMA breakdown from 50DMA support. TSLA traversed the entire lower-Bollinger Band (BB) channel in a bearish engulfing pattern. This is a pattern where initial buying breaks the previous day’s high in what looks like a positive turn-around only to quickly give way to a hasty retreat and close even below the previous day’s low.
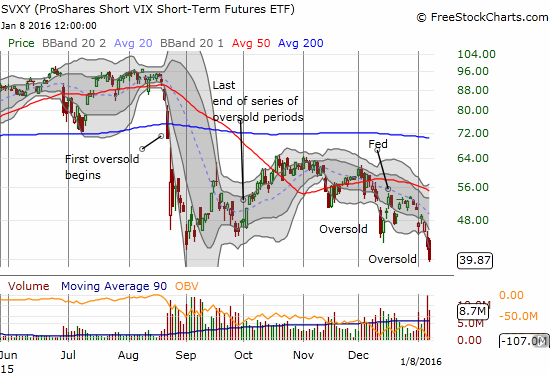
On the bullish side, I did not add to my holdings of call options on ProShares Ultra S&P500 (SSO). I am definitely targeting call options AND shares if the oversold period goes any deeper this week. I DID add to my bets against volatility. I bought put options on ProShares Ultra VIX Short-Term Futures (UVXY)and more shares of ProShares Short VIX Short-Term Futures (SVXY).
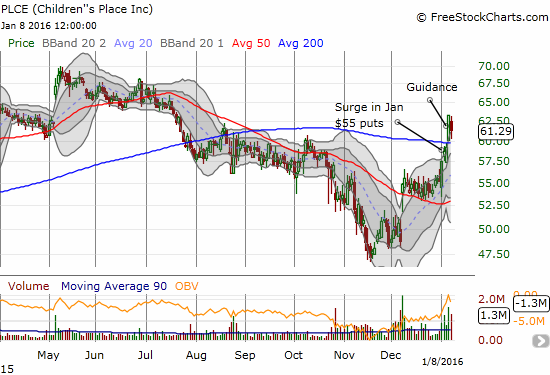
This is also a time to scout out strong buying opportunities – stocks that might lead the charge out of oversold trading conditions. I found an interesting candidate in Children’s Place (PLCE). Traders loaded up on put options ahead of the company’s latest guidance. That guidance turned out to be good enough for a strong and bullish 200DMA breakout. This is an impressive move during oversold trading conditions where T2107 is tanking. The pullback on Friday looks a small window to participate at a slightly lower price.
On the other hand, I sold my long-term call option on Wal-Mart Stores (WMT). As I discussed earlier, I only planned to hold onto my fortuitous profits another day if some news came out to explain the recent run-up. None was forthcoming. I was fortunate to sell right at the open.
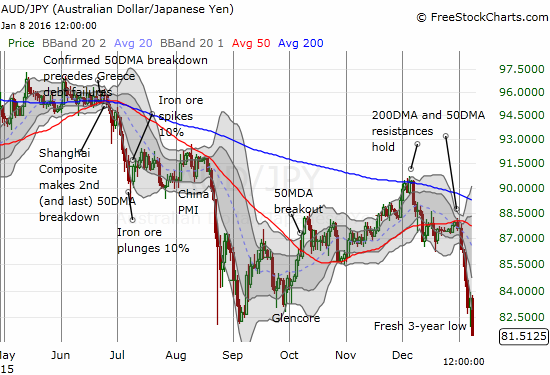
Finally, the currency markets are relatively quiet in overnight trading ahead of Monday’s open. The Australian dollar (FXA) versus the Japanese yen (JPY) is trying again to print a bottom. If this holds into the U.S. open, it could start the launching pad for the highly anticipated oversold bounce.
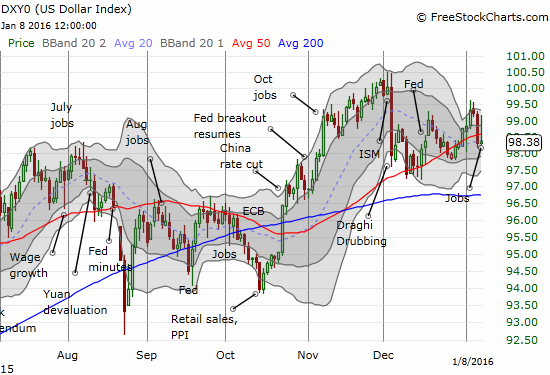
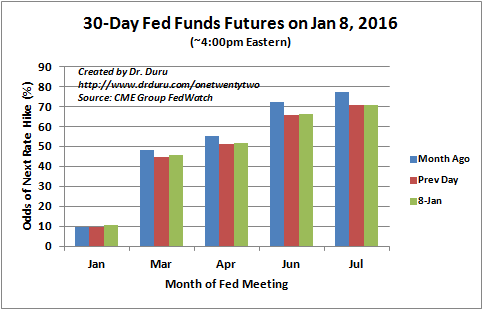
The U.S. dollar index (DXY) ended the day with little gain. The index initially rallied all the way to the previous day’s high. The small net gain is consistent with a market that barely bumped up the odds of rate hikes in the wake of the U.S. jobs report.
Daily T2108 vs the S&P 500
")
Black line: T2108 (measured on the right); Green line: S&P 500 (for comparative purposes)
Red line: T2108 Overbought (70%); Blue line: T2108 Oversold (20%)
Weekly T2108

*All charts created using freestockcharts.com unless otherwise stated
The charts above are the my LATEST updates independent of the date of this given T2108 post. For my latest T2108 post click here.
Related links:
The T2108 Resource Page
Expanded daily chart of T2108 versus the S&P 500
Expanded weekly chart of T2108
Be careful out there!
Full disclosure: long SVXY shares, long UVXY put options, long SSO call options, net long the U.S. dollar, net short the Australian dollar, long and short various currencies versus the Japanese yen