
(T2108 measures the percentage of stocks trading above their respective 40-day moving averages [DMAs]. It helps to identify extremes in market sentiment that are likely to reverse. To learn more about it, see my T2108 Resource Page. You can follow real-time T2108 commentary on twitter using the #T2108 hashtag. T2108-related trades and other trades are occasionally posted on twitter using the #120trade hashtag. T2107 measures the percentage of stocks trading above their respective 200DMAs)
T2108 Status: 34.0%
T2107 Status: 36.0%
VIX Status: 13.6
General (Short-term) Trading Call: Neutral
Active T2108 periods: Day #203 over 20%, Day #11 over 30% (overperiod), Day #18 under 40%, Day #58 under 50%, Day #75 under 60%, Day #274 under 70%
Reference Charts (click for view of last 6 months from Stockcharts.com):
S&P 500 or SPY
SDS (ProShares UltraShort S&P500)
U.S. Dollar Index (volatility index)
EEM (iShares MSCI Emerging Markets)
VIX (volatility index)
VXX (iPath S&P 500 VIX Short-Term Futures ETN)
EWG (iShares MSCI Germany Index Fund)
CAT (Caterpillar).
Commentary
After the soaring rally on Monday, I was preparing to write a T2108 Update called something like “An Opening in the Fog.” I intended to review how Monday relieved some of the bearish conditions I discussed in the last T2108 Update. It was a strange day because China had reported more weak economic data and commodities led the charge with broad and very strong gains. It was a rally out of nowhere and media outlets struggled to explain it. They reached for any good news to be found, so Warren Buffet’s latest toy, Precision Castparts (PCP), was crowned as a key driver. Bob Pisani on CNBC had a much better explanation: stocks were very oversold.
I never wrote that piece.
Instead, as I prepared to write some thoughts, news broke of China’s devaluation of the yuan. As I described in “The Australian Dollar Weathers Another Test,” the reaction in currency markets was immediate and pronounced. It made no sense for me to write anything until I could observe the reaction in equity markets. The S&P 500 (SPY) promptly reversed all its gains from Monday and bounced meekly from support at its 200-day moving average (DMA). I told a friend of mine that Monday’s bullish rally could be the biggest fake-out of the year. He agreed…unless Tuesday’s trading turned out to be the big fake-out. How prophetic!
A second devaluation of the yuan sent sellers buzzing again. The 200DMA gave way like butter, and T2108 traded as low as 27.6%.
%stocks>40DMA around 28% now. "Close enough" to oversold again. 200DMA decisively broken on S&P 500, but below lower-BB now. #T2108 $SPY
— Dr. Duru (@DrDuru) August 12, 2015
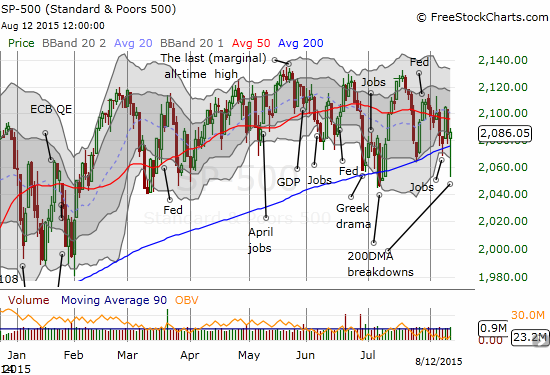
Trading well below its lower-Bollinger Band (BB), the S&P 500 was in a classic position for a bounce. With T2108 “close enough” to oversold, it was primed for the exact kind of bounce I love to play. However, I did not get very aggressive – the weakening technicals of the market are now nagging me. I quickly moved to lock in profits on some put options, I loaded up on Netflix (NFLX) (I should have moved on Amazon.com (AMZN) too!), and I bought a single put option on ProShares Ultra VIX Short-Term Futures (UVXY). Sure enough, as the graph above shows, the market bounced right back. The 200DMA for the S&P 500 once again proves its mettle over sellers and bears. Leading the way was Apple (AAPL).
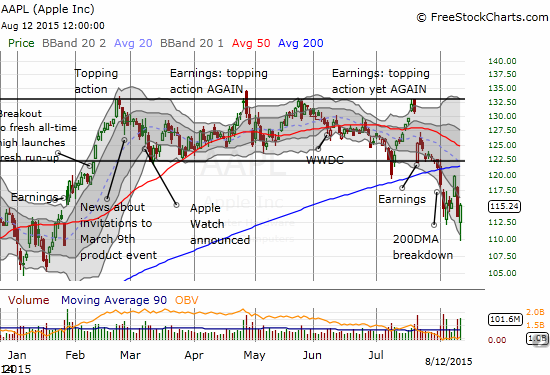
This move on Apple (AAPL) would have been a tremendous winner in the options pits. For whatever reason, I did not make a move…even when I saw AAPL had fought back to even on the day. This lack of action was also a failure of action because I already have a put spread in place on AAPL that covers the downside that I think is yet to come in the stock. I allowed the vicious reversal the previous day to make me too tentative.
AAPL soared with the market on Monday in what looked like the first stage of an attack on 200DMA resistance. The stock gained 3.6%. On Tuesday’s sell-off, AAPL printed a very bearish gap down and the selling never relented on the day. APPL lost a whopping 5.2% to a fresh post-earnings low as fears ran rampant that China’s apparent economic woes are going to ding Apple’s financial performance. I chose to hold onto my put spread even though it had become very profitable. These kinds of reversals are so powerful, they typically have immediate follow-through. Not this time! Today’s rally was encouraging for bulls, especially given the strong buying volume, but AAPL remains locked in a downward channel in the middle of a 200DMA breakdown. The bias is downward until buyers can close AAPL above its 200DMA again.
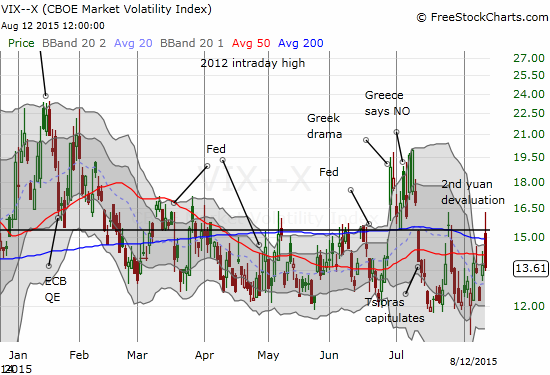
The behavior of the volatility index, the VIX, was also telling. At its high, the VIX was trading above the critical 15.35 pivot, but it was also well above its upper-BB. This over-extension further bolstered the case for a bounce back in the market. It encouraged me to buy the put option on UVXY, but I really should have loaded up in this context. The VIX ended the day with a complete fade back to yesterday’s close. The VIX traded with a gain as high as 19%!
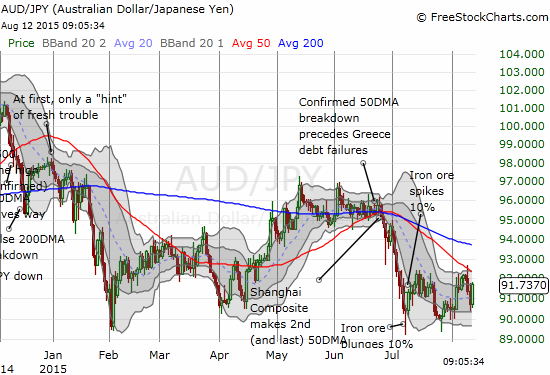
My other important indicator, AUD/JPY, the Australian dollar (FXA) versus the Japanese yen (FXY), is looking surprisingly less bearish. By the time U.S. trading opened, AUD/JPY was trading exactly where it stood at the close of Tuesday’s trading. It crept higher from there. The daily chart shows that AUD/JPY seems ready to reverse this week’s earlier angst although the 50DMA looms overhead as resistance. A close above that line would make me bullish on the market as a whole, but I am not expecting such an encouraging sign.
Overall, the market is exhibiting signs of increasing instability as it swings in manic fashion from strong rallies to strong selling. The net result of this amplified chop is a vicious stalemate between bears and bulls. However, all the elements seem to be converging for a very large breakout/down. While my short-term trading bias sits at neutral, I am eyeing the bearish case most closely right now.
On Tuesday, Terex (TEX) was snagged in an M&A deal that reminded me of Joy Global (JOY).
$TEX M&A deal reminded me of $JOY. Trading at 0.75x sales and at book value, seems like a juicy M&A target for long-term thinking company
— Dr. Duru (@DrDuru) August 11, 2015
I immediately bought a speculative call option on JOY expiring next year.
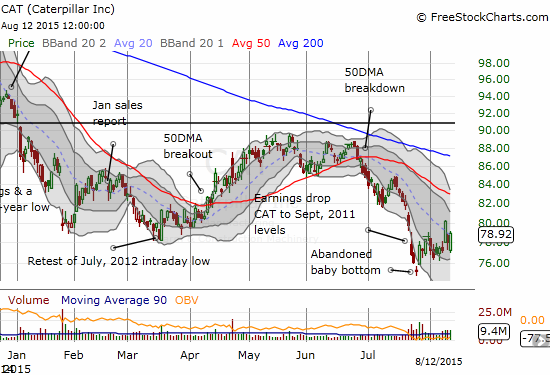
Similarly, I looked over the technical condition of Caterpillar, Inc (CAT), my favorite hedge against bullishness. I have passed over several opportunities to lock in profits on my current set of put options on CAT. Monday’s rally really killed that position. Tuesday’s selling and Wednesday’s initial selling brought back much of those profits. Given the wild volatility of this amplified chop and CAT’s heavy dependence on commodities and China’s health, I have decided to just hold these puts through next week’s expiration even as CAT’s chart is getting ever so slowly more bullish: the abandoned baby bottom from July 27th is looking increasingly solid.
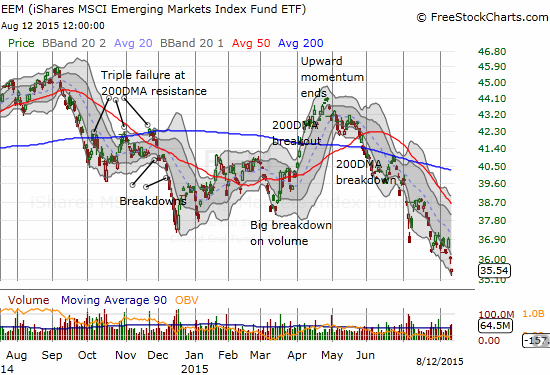
On a related note, the iShares MSCI Emerging Markets ETF (EEM) has resolved to the downside. The chop that preceded the breakdown wasted time and energy on my positions, so I decided to take the profits on my EEM put options and see what happens. I could not afford to see EEM chop higher with expiration coming up next week. For good measure, I bought a fresh set of call options expiring next month in the midst of Tuesday’s selling. I plan to refresh puts on the next rally.
Finally, I have benefited from two particularly gratifying moves this week: Google (GOOG) and SPDR Gold Trust (GLD).
Google (GOOG) sprinted higher on the heels of a major corporate restructuring into an entity called “Alphabet.” I immediately closed out most of my call options in what is likely to be my biggest and best trade of the year. I reaffirmed my aggressive bullishness on GOOG in “Valuations for Internet Stocks Disrupted by Second Quarter 2015 Earnings.”
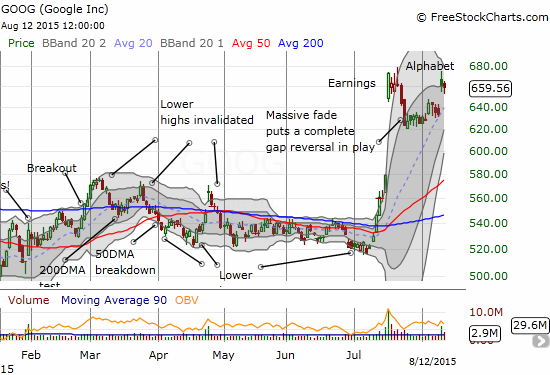
While this gap up seems like an over-reaction to the news, it is not so large considering the context. All GOOG did was return to its post-earnings high. The Alphabet news brought back the earlier ebullience in the stock in one big rush. In fact, it was the prospect of a return to post-earnings high that got me into my call options. Of course, I did not expect things to unfold as they did.
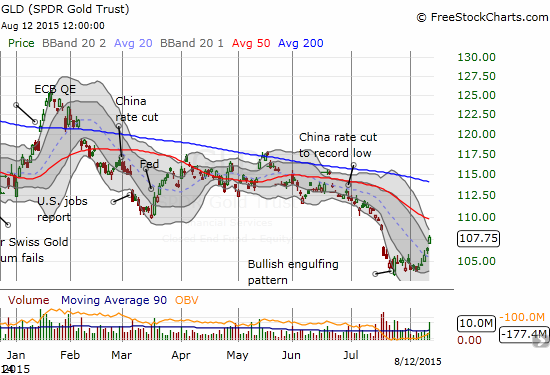
In “The Commodity Crash Accelerates: A New Juncture For Buying Gold“, I made a case for a bottom in GLD. My method of using Google trends as a measure of market sentiment and assessing extreme moves on GLD has once again received validation. Next up for GLD is a very ominous overhead resistance from its 50DMA.
Daily T2108 vs the S&P 500
")
Black line: T2108 (measured on the right); Green line: S&P 500 (for comparative purposes)
Red line: T2108 Overbought (70%); Blue line: T2108 Oversold (20%)
Weekly T2108

*All charts created using freestockcharts.com unless otherwise stated
The charts above are the my LATEST updates independent of the date of this given T2108 post. For my latest T2108 post click here.
Related links:
The T2108 Resource Page
Expanded daily chart of T2108 versus the S&P 500
Expanded weekly chart of T2108
Be careful out there!
Full disclosure: long JOY call options, long CAT puts, long UVXY puts, long AAPL put spread, long NFLX call options, short AUD/JPY, long GOOG call options, long GLD shares and call options