
(T2108 measures the percentage of stocks trading above their respective 40-day moving averages [DMAs]. It helps to identify extremes in market sentiment that are likely to reverse. To learn more about it, see my T2108 Resource Page. You can follow real-time T2108 commentary on twitter using the #T2108 hashtag. T2108-related trades and other trades are occasionally posted on twitter using the #120trade hashtag. T2107 measures the percentage of stocks trading above their respective 200DMAs)
T2108 Status: 60.2%
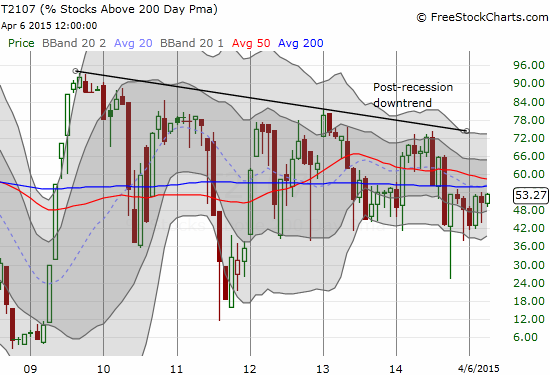
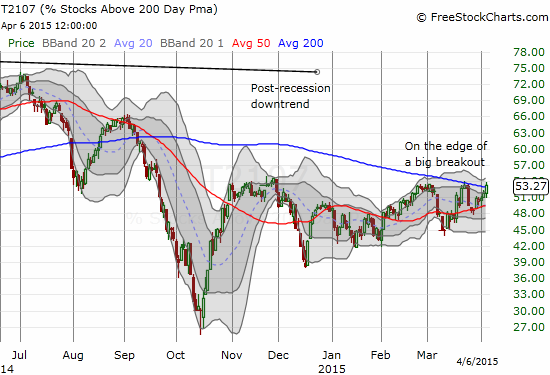
T2107 Status: 53.3% (on the edge of a breakout?!)
VIX Status: 14.7
General (Short-term) Trading Call: Neutral. Market still seems stuck in a chopfest BUT now T2107 is showing the potential for an important breakout
Active T2108 periods: Day #115 over 20%, Day #74 above 30%, Day #18 above 40%, Day #2 over 50%, Day #1 over 60% (overperiod), Day #185 under 70%
Reference Charts (click for view of last 6 months from Stockcharts.com):
S&P 500 or SPY
SDS (ProShares UltraShort S&P500)
U.S. Dollar Index (volatility index)
EEM (iShares MSCI Emerging Markets)
VIX (volatility index)
VXX (iPath S&P 500 VIX Short-Term Futures ETN)
EWG (iShares MSCI Germany Index Fund)
CAT (Caterpillar).
Commentary
“The market was closed on Friday, April 3rd, so we still have to wait until Monday, April 6 to see how the market reacts to the job report for March. If the drop in the U.S. dollar is any indication, the market should at least open lower…
…Then again, the U.S. market supposedly does not like a strong dollar. If so, it stands to reason that stocks could rally. After all, a poor jobs report means the Fed stays easier for longer.”
I began the last T2108 Update with this quote. It formed my premise that the stock market remains deeply entrenched in a chopfest. Sure enough, the S&P 500 (SPY) gapped down, bounced, and almost never looked back (the gap down is much clearer in the chart for SPY).
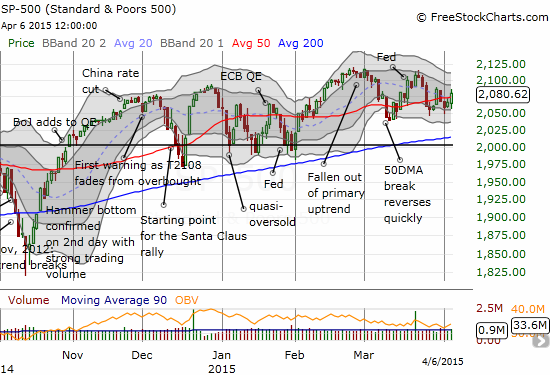
I know the move bewildered some folks, especially bears. Honestly, even with my suspicion that the market could still close with a gain on the day, I was taken aback by the nearly unfettered buying spree that sent the stock market soaring as if genuinely good news had occurred in Friday’s jobs report. Just one of those days where you have to stay nimble, remain skeptical, and accept what the market IS doing and not what it SHOULD do.
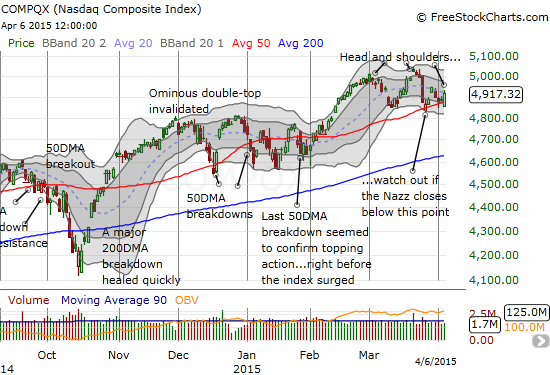
The NASDAQ (QQQ) has more of my interest than usual as it seems to be forming a head and shoulders pattern. The current bounce has formed the right shoulder of a head and shoulders pattern. The head is conveniently placed right around the 5000 mark. If the NASDAQ finally achieves that fresh all-time high, look out above. If the NASDAQ confirms the head and shoulders top with a close below the low of the pattern, look out below.
Also catching more of my attention now is T2107, the percentage of stocks trading above their respective 200-day moving averages. As regular readers know, I have marveled at how this technical indicator has stayed in a downtrend during most of the post-recession move off the March, 2009 lows. It is a sure sign that the heavy-lifting in the persistent uptrend in the market has occurred among an elite core. Well, today, with T2108 closing at 60.1% and teasing us with another approach to overbought status, T2107 is now teasing us with a potentially major breakout. If T2107 can continue advancing, the crop of stocks reclaiming the all-important long-term 200DMA trendline could cause an important domino effect. This crew could nudge the S&P 500 to a fresh all-time high. T2108 could FINALLY revisit overbought status after an amazingly long hiatus of 185 trading days.
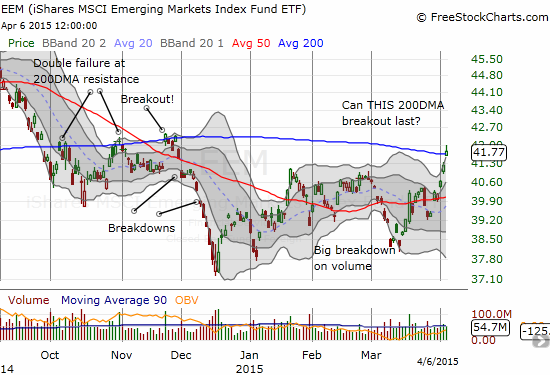
Speaking of teasing breakouts, here is iShares MSCI Emerging Markets (EEM) continuing its streak higher. Can this latest peek above the 200DMA last? I certainly think EEM is stretched enough to warrant a refresh on a hedged play (a call and put option combination called a strangle).
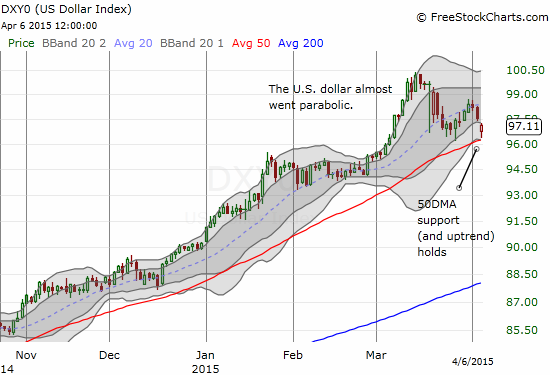
In currency markets, the descent of the dollar helped rationalize a lot of gains in commodities and the U.S. stock market. Yet, the U.S. dollar actually spent the day creeping back. This move left the story ringing a bit hollow as the uptrend from the 50DMA support held firm.
So, who really knows what in the world was going on Monday except traders and investors with sufficient buying power decided to fade the gap down from Friday’s jobs report. More traders and investors interpreted that move as a bullish sign (the Fed will never raise rates again perhaps?) and kept the momentum alive for most of the day. And who knows whether this conviction will last. Another earnings season is now right around the corner, ready to challenge bulls and bears alike.
The day’s reversal helped drive (or maybe IT was driven by) a fantastic reversal for Apple (AAPL). The timing could not have been worse for my Apple Trading Model. I JUST published an update showing a long overdue “revelation” that AAPL makes exactly THESE kinds of moves only 20 to 25% of the time. Helping to reinforce the trading loss I made on Monday was the lack of trading Friday, so I did not have the other half of my model to at least warn me of a contrary prediction for a positive close. I even ignored the picture-perfect bounce off the 50DMA and went to work fading AAPL once it hit near even on the day. The chart speaks volumes on how poorly THAT worked out!
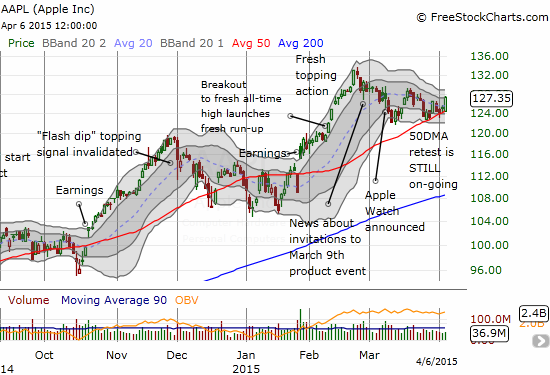
I suppose the “good news” is that AAPL has “used up” its one reversal per week, and I can look forward to more compliant behavior going forward. The odds are very high for an up close for Tuesday: 62% using data starting in 2014 and 85% using data starting in 2015. The odds of AAPL maintaining its momentum from the open are similarly high. If AAPL opens in the red, I will just sit. If it opens in the green, I will assume another bullish day. If you look closely at the chart above, today’s move helped to put a subtle upward bend in the upper-Bollinger Bands. This signifies good odds that the momentum for AAPL is finally swinging out of the downtrend in place since the last all-time high.
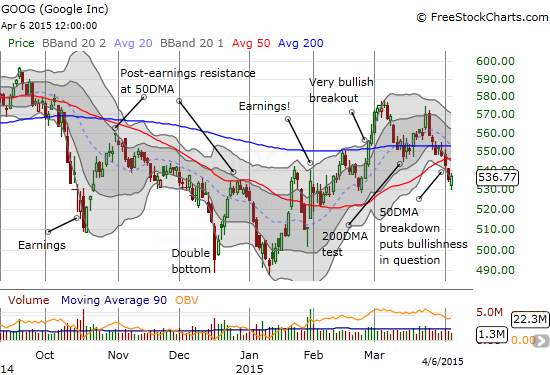
Finally, here is a look at Google (GOOG). I had identified the stock as an unqualified bullish stock no matter what was going on in the rest of the market. I granted GOOG leeway down to the 50DMA. As luck would have it, the 50DMA rushed up toward the 200DMA quickly, and the stock ran right out of room. The 50DMA breakdown that started last week has me back to neutral. However, with traders fading gaps all over the market, I could not help but refresh the bullish vibe with GOOG. I locked in my profits toward the close; as a reminder, my assumption that market remains in a chopfest has me eager to take profits more quickly than usual on short-term trades.
Daily T2108 vs the S&P 500
")
Black line: T2108 (measured on the right); Green line: S&P 500 (for comparative purposes)
Red line: T2108 Overbought (70%); Blue line: T2108 Oversold (20%)
Weekly T2108

*All charts created using freestockcharts.com unless otherwise stated
The T2108 Resource Page
Expanded daily chart of T2108 versus the S&P 500
Expanded weekly chart of T2108
Be careful out there!
Full disclosure: net long the U.S. dollar, long AAPL puts