
(T2108 measures the percentage of stocks trading above their respective 40-day moving averages [DMAs]. It helps to identify extremes in market sentiment that are likely to reverse. To learn more about it, see my T2108 Resource Page. You can follow real-time T2108 commentary on twitter using the #T2108 hashtag. T2108-related trades and other trades are sometimes posted on twitter using the #120trade hashtag. T2107 measures the percentage of stocks trading above their respective 200DMAs)
T2108 Status: 43.5%
T2107 Status: 44.0%
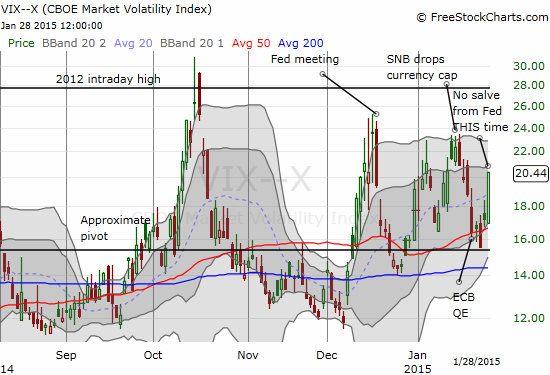
VIX Status: 20.4 (an 18.7% increase)
General (Short-term) Trading Call: Bearish (S&P 500 under 50DMA)
Active T2108 periods: Day #69 over 20%, Day #28 above 30%, Day #8 over 40% (overperiod), day #1 under 50% (underperiod), Day #38 under 60% (underperiod), Day #139 under 70%
Reference Charts (click for view of last 6 months from Stockcharts.com):
S&P 500 or SPY
SDS (ProShares UltraShort S&P500)
U.S. Dollar Index (volatility index)
EEM (iShares MSCI Emerging Markets)
VIX (volatility index)
VXX (iPath S&P 500 VIX Short-Term Futures ETN)
EWG (iShares MSCI Germany Index Fund)
CAT (Caterpillar).
Commentary
Apple (AAPL) could not save the day. The Federal Reserve could not provide a salve. So much for the “almost” bullish divergence between T2108 and the S&P 500 (SPY) yesterday.
T2108 dropped to 43.5%. The S&P 500 extended its losses from yesterday to close right at the “Santa Claus” pivot in the current chopfest.
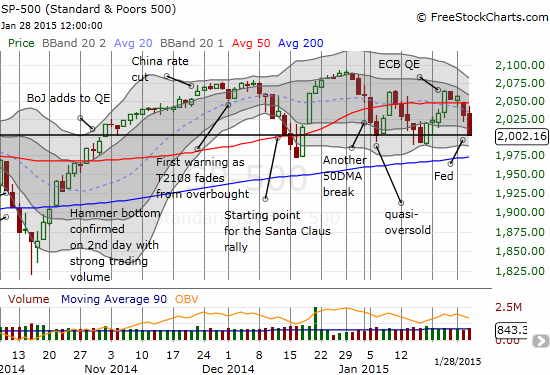
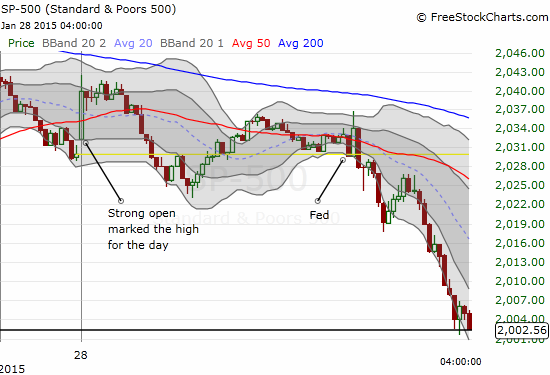
The trading bias stays at bearish thanks to this latest confirmation of the 50DMA pivot. A retest of 200DMA support is once again back in play. The chart does not make it clear but the market fell apart around 2pm Eastern. Since the Fed statement was released at that point, I can conveniently blame the Fed for the loss.
Whatever spooked the market, spooked it REAL good. (I think the mainstream media headlines I have seen completely missed the point about a statement that was almost a carbon copy of the December one – the Fed is NOT worried about low inflation. It is MORE convinced that low inflation is transitory.) The volatility index, the VIX, soared 18.7%. I am of course VERY relieved I did not try my typical pre-Fed fade of volatility. As I discussed in the last T2108 Update, the jump in volatility ahead of the meeting was simply not large enough.
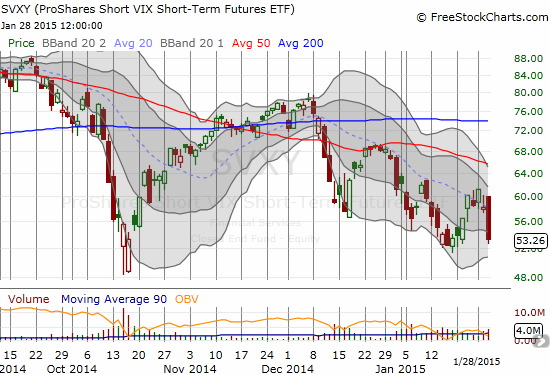
The VIX’s gain was of course a huge loss for the shares I would have have purchased ahead of the Fed meeting: ProShares Short VIX Short-Term Futures (SVXY). SVXY’s 8.6% loss has me prepared to get back into shares on the next plunge. Given the current downtrend channel, a tag of 48 or so would mark an excellent entry. It also happens to match the October low.
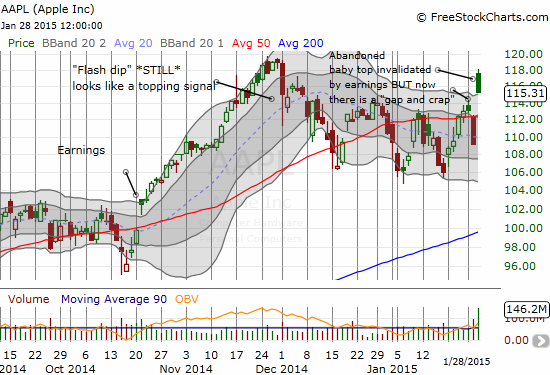
The selling caught me by surprise because I thought Apple’s strong open would set a positive tone for the entire day, even with the Fed. Instead, even Apple (AAPL) succumbed gravitational forces and closed at its upper-Bollinger Band (BB). This forms a “gap and crap” pattern. The fade does not surprise me, but I was not willing to make a fresh bearish bet on such expectations: 1) Bollinger Bands tend to act like short-term magnets when stocks move “too far” above or below them, 2) optimism is extremely high in AAPL, and 3) AAPL rallied right into the teeth of resistance formed by the “flash dip.” The Apple Trading Model (ATM) projects 78% odds for a positive close tomorrow, but 70 to 86% odds that AAPL will fade from its open. This setup means I will fade AAPL if it gaps up and I will buy it if it gaps lower (the projection for the close gets priority). Similarly, I might make contrary trades if I feel AAPL is reaching a high/low for the day.
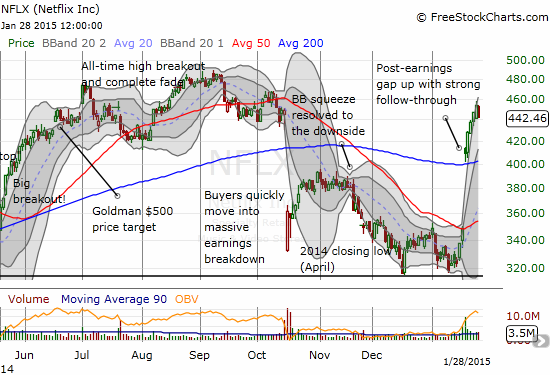
Netflix (NFLX) is a stock which defied the “magnetic rule” for its Bollinger Bands as long as it could. Today, the momentum finally hit the pause bottom. NFLX has closed the gap down from October, so it is very possible it churns from this point for some time. I have played the post-earnings momentum by going short shares as a hedge against buying call options. I bought a fresh one on today’s pullback.
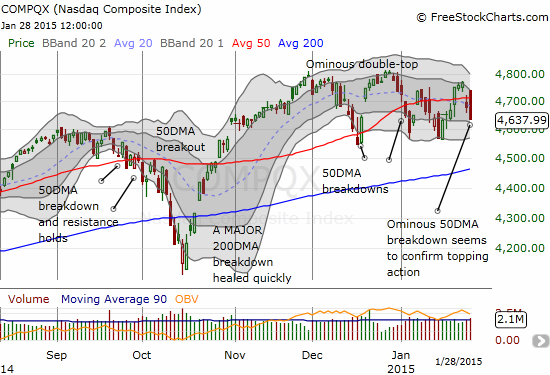
Speaking of tech, I am now officially wary and essentially bearish on the NASDAQ (QQQ). Today’s pullback looks a lot worse for the tech-laden index than for the S&P 500. Like the S&P 500, the 50DMA is acting as a pivot in the current chopfest. Unlike the S&P 500, the NASDAQ printed a clear and present danger in the form of an ominous double-top across late November to December. Today’s drop seemingly confirmed that top. A new low, below the current chop, would be the final lock on the bearish case.
Daily T2108 vs the S&P 500
")
Black line: T2108 (measured on the right); Green line: S&P 500 (for comparative purposes)
Red line: T2108 Overbought (70%); Blue line: T2108 Oversold (20%)
Weekly T2108

*All charts created using freestockcharts.com unless otherwise stated
The T2108 Resource Page
Expanded daily chart of T2108 versus the S&P 500
Expanded weekly chart of T2108
Be careful out there!
Full disclosure: long AAPL put, put spread, and call; short NFLX and long NFLX call
Dr. Duru,
I want to thank you again for the charts to validate your trading rationale.
I picked up a little SVXY just before the close yesterday at 52.90.
I will add some VIXY if the market if the market rolls over and heads south
for protection this morning.
Ray
Thank you for reading! And good luck with SVXY. I ALMOST pulled the trigger this morning seeing AAPL doing so well, but instead I am first going to see whether I can nab it around $48. Regardless, I think you will be fine in due time…