
(T2108 measures the percentage of stocks trading above their respective 40-day moving averages [DMAs]. It helps to identify extremes in market sentiment that are likely to reverse. To learn more about it, see my T2108 Resource Page. You can follow real-time T2108 commentary on twitter using the #T2108 hashtag. T2108-related trades and other trades are sometimes posted on twitter using the #120trade hashtag. T2107 measures the percentage of stocks trading above their respective 200DMAs)
T2108 Status: 41.7%
T2107 Status: 43.2%
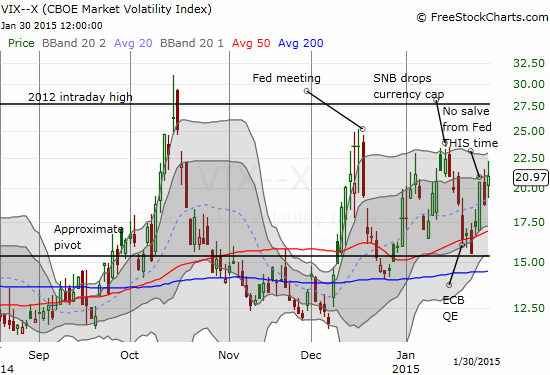
VIX Status: 21.0
General (Short-term) Trading Call: Bearish (S&P 500 still under 50DMA)
Active T2108 periods: Day #71 over 20%, Day #30 above 30%, Day #10 over 40% (overperiod), day #3 under 50% (underperiod), Day #40 under 60% (underperiod), Day #141 under 70%
Reference Charts (click for view of last 6 months from Stockcharts.com):
S&P 500 or SPY
SDS (ProShares UltraShort S&P500)
U.S. Dollar Index (volatility index)
EEM (iShares MSCI Emerging Markets)
VIX (volatility index)
VXX (iPath S&P 500 VIX Short-Term Futures ETN)
EWG (iShares MSCI Germany Index Fund)
CAT (Caterpillar).
Commentary
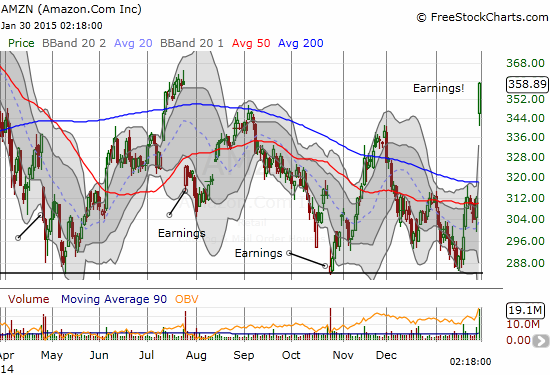
The tremendous surge in response to earnings from Amazon.com (AMZN) could not prevent it…
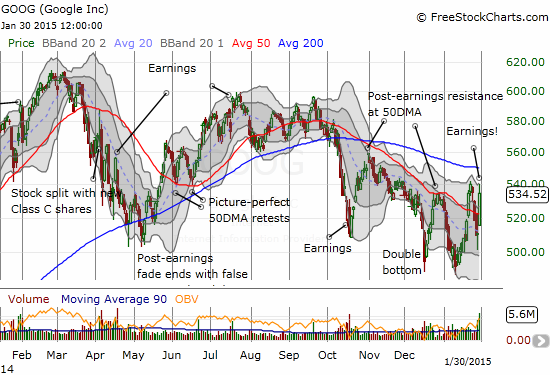
The resurgent post-earnings Google (GOOG) could not prevent it…
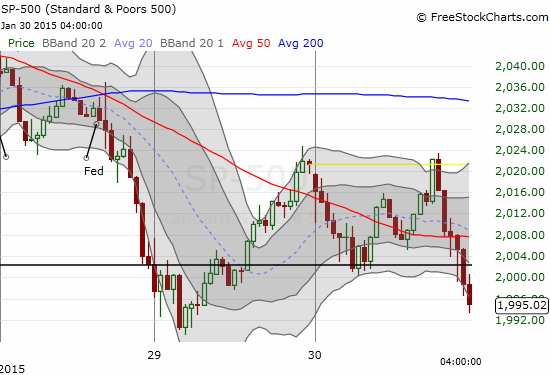
The S&P 500 (SPY) lost 1.3% as it continues to chop its way toward its 200DMA support…
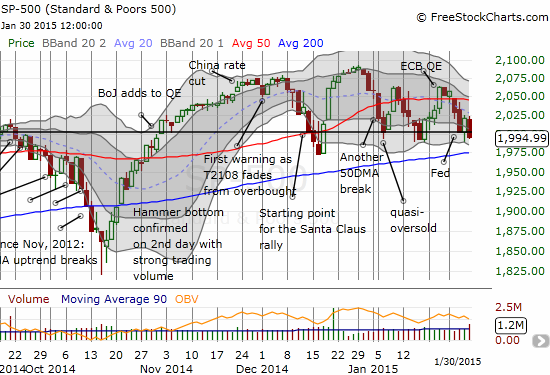
…and for the second time in 3 days, the index slid sharply into the close. The entire loss of the day can be described in the last 90 minutes of trading action.
This sudden drop in the S&P 500 (SPY) was enough to send volatility upward for a 12% gain. For the month of January, volatility has managed hold its own. I see January’s action as confirming follow-through to December’s show of strength. This is a notable comeback in the wake of the continued fade in November from October’s outburst. The VIX has now maintained elevated levels that have effectively used the old, reliable 15.35 pivot as support.
Right at the close, the VIX pulled back a bit from the high. The action was so fast that ProShares Short VIX Short-Term Futures (SVXY) did not adjust from a big plunge into a retest of the intraday low from October.
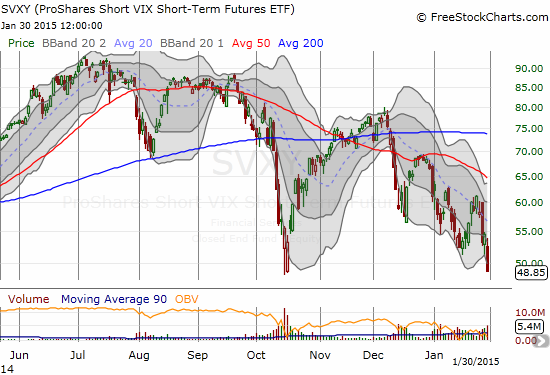
This was the plunge in SVXY I was looking for when I wrote in the last T2108 Update. Once again, the move in the VIX caught me by surprise. I barely managed to buy SVXY right before the close. In another twist of the swift move, SVXY almost instantly gained a point after the closing bell. While I like this spot for a buy on SVXY, I am still duly noting that SVXY has begun what looks like a downtrend channel even as the VIX has bounced in a range. This means it will take lower and lower levels of SVXY to motivate me to buy as a fade on volatility. Traders should also brace for the increasing likelihood that that volatility will eventually break out above recent highs. For now, with 200DMA support nearby for the S&P 500, I will look for opportunities to add put options on ProShares Ultra VIX Short-Term Futures (UVXY) to add to the volatility fade for the current cycle.
The market’s willingness to generate such strong gains on AMZN and GOOG are notable and suggest that buyers will be ready for more come Monday. It is interesting to see that BOTH stocks had trading volume well above average going into earnings, and AMZN even had a healthy one-day gain. That was surprise #1. Surprise #2 was AMZN’s ability to continue soaring well above its upper-Bollinger Band (BB) even after gapping up 11%. My post-earnings trading strategy is to buy AMZN at the open no matter what, but I simply could not stomach doing so on such a huge move. Unfortunately, I DID pick a side to trade post-earnings GOOG, the wrong side. In after-hours trading post-earnings, GOOG fell as low as $490 before rebounding sharply and ending the session around flat with the close. When GOOG gapped up at the open, I assumed that the most likely course for the day would be stiff 50DMA resistance that would hep return GOOG to its after hours levels. Surprise #3 was how easily that resistance gave way instead. If GOOG manages to close above its January high, it becomes a buy again even with looming 200DMA resistance overhead.
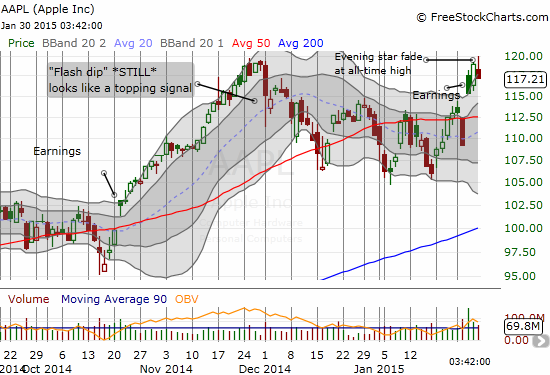
Apple (AAPL) was not able to participate in the relative strength of AMZN and GOOG. Instead, AAPL’s stock fell with the market and in the process produced another ominous topping pattern. This time, AAPL faded hard from an all-time intraday high. Just like the fade on the day after earnings, it brought the stock back to its upper-BB. I made a speculative play and bought AAPL call options at the close in anticipation of good tidings from the Apple Trading Model (ATM). The model did not cooperate: it projected a mere 23% likelihood for a positive close on Monday. Adding to the bearishness, the odds are high for a close lower than the open. If I am fortunate to get a good gap up at the open, I will likely sell the AAPL calls right away (often a good strategy on strong Monday opens anyway). Interestingly, using data prior to 2014 data produces good odds of a positive Monday close for AAPL.
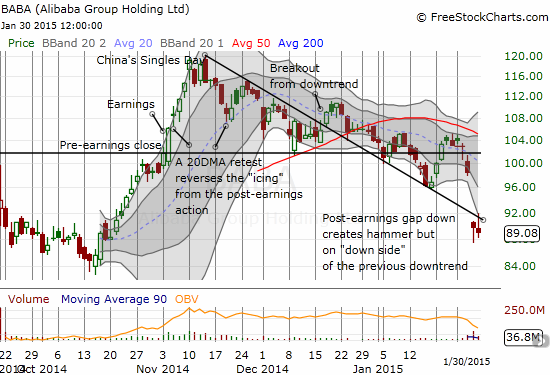
Adding to the bearish weight on the market is Alibaba Group Holding Limited (BABA). Thhe post-earnings gap down on Thursday essentially puts an exclamation point on the end of the “Ali Rah Rah pop“, my tongue-in-cheek characterization for the assumption last year that the BABA IPO marked a market top. The S&P 500 closed at 2110 that day. The current chopping range has sent the S&P 500 both above and below that level; the index is currently below. For BABA, the issue is the revival of its former downtrend. I was fortunate to have put options in place ahead of earnings: I did not like the ominous selling ahead of earnings that confirmed 50DMA resistance and took the stock below its close from its first earnings. These were both bearish signals. I took some of those profits and added a few more shares to my position. Another major decision point will come if BABA cracks a fresh all-time low.
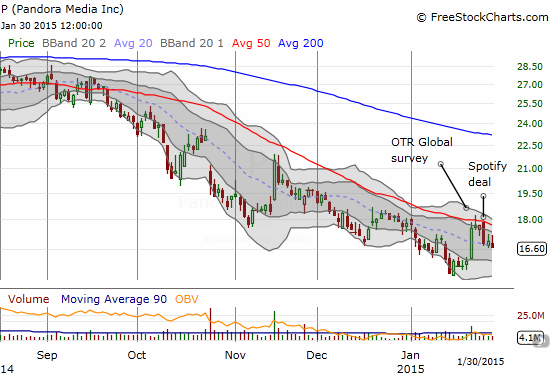
Pandora (P) is another tech stock with a bearish technical outlook. As I explained last week, I was looking for an excuse to make a bearish pre-earnings play. That excuse came in the form of a major failure at 50DMA resistance. I waited two more days looking for a fresh bounce to fade before buying the put options. The bounce on Friday was as weak as Thursday, so I went ahead and pulled the trigger.
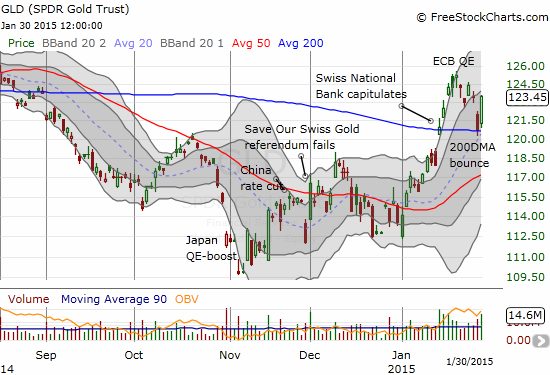
Finally, SPDR Gold Shares (GLD) received a nice bounce off its 200DMA. I wrote last week that I had retreated from the short-term GLD trade despite the nice technical breakout and subsequent “soft” pullback. I doubt GLD will trade above the recent high in the short-term but if buyers manage to push it there, GLD should extend its rally for at least a short while longer. (My core long-term position remains in place).
Daily T2108 vs the S&P 500
")
Black line: T2108 (measured on the right); Green line: S&P 500 (for comparative purposes)
Red line: T2108 Overbought (70%); Blue line: T2108 Oversold (20%)
Weekly T2108

*All charts created using freestockcharts.com unless otherwise stated
The T2108 Resource Page
Expanded daily chart of T2108 versus the S&P 500
Expanded weekly chart of T2108
Be careful out there!
Full disclosure: long AAPL calls; long SVXY, long P puts, long GOOG put