
(T2108 measures the percentage of stocks trading above their respective 40-day moving averages [DMAs]. It helps to identify extremes in market sentiment that are likely to reverse. To learn more about it, see my T2108 Resource Page. You can follow real-time T2108 commentary on twitter using the #T2108 hashtag. T2108-related trades and other trades are sometimes posted on twitter using the #120trade hashtag. T2107 measures the percentage of stocks trading above their respective 200DMAs)
T2108 Status: 51.5%
T2107 Status: 46.5%
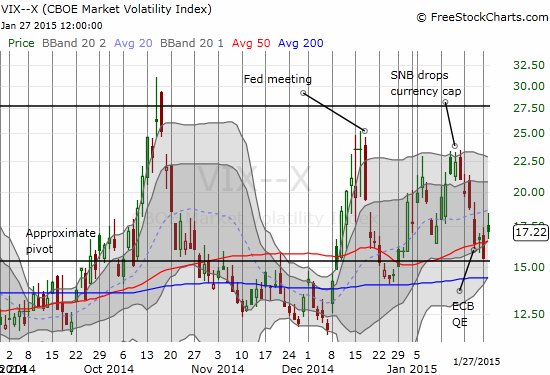
VIX Status: 17.2
General (Short-term) Trading Call: Bearish (only because S&P 500 is now below its 50DMA. Overall, market remains in a “chopfest” trading range and bear/bull calls are NOT stable)
Active T2108 periods: Day #68 over 20%, Day #27 above 30%, Day #7 over 40%, day #2 over 50% (overperiod), Day #37 under 60% (underperiod), Day #138 under 70%
Reference Charts (click for view of last 6 months from Stockcharts.com):
S&P 500 or SPY
SDS (ProShares UltraShort S&P500)
U.S. Dollar Index (volatility index)
EEM (iShares MSCI Emerging Markets)
VIX (volatility index)
VXX (iPath S&P 500 VIX Short-Term Futures ETN)
EWG (iShares MSCI Germany Index Fund)
CAT (Caterpillar).
Commentary
Having multiple components of the Dow Jones Industrial Average (DIA) report disappointing earnings was just too much for the market to handle. Sympathy selling helped send the S&P 500 (SPY) below its 50DMA for the fourth time in just 6 weeks. The index lost 1.3% on the day. The chart below shows a trading range that has lasted at least 3 months, creating an official chopfest. The 50DMA AND the line marking the start of last month’s “Santa Claus” rally are serving as pivots. This pattern makes bear/bull calls very unstable and rewards flexibility and mobility.

Today’s loss finished the reversal of all the S&P 500’s gains post ECB QE (European Central Bank quantitative easing). T1208 fared much better as it bounced of its lows and managed to lose a mere two percentage points. This is not quite a bullish divergence, but it does set up a potentially strong day as the market gets revved up for another Federal Reserve decision. I ALMOST put on another fade volatility trade in anticipation of more soothing words from the Fed, but the jump in volatility was not nearly extreme enough to setup a good risk/reward trade.
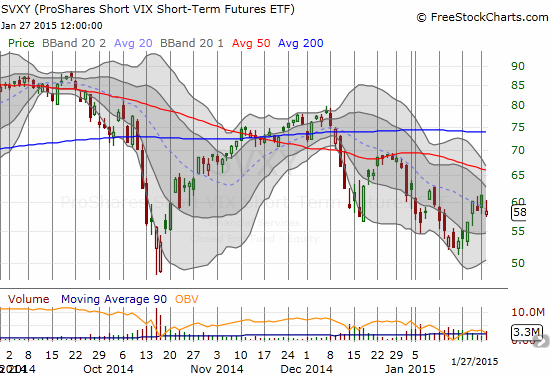
At this point, I need to wait for another extreme move in volatility – a steep drop in ProShares Short VIX Short-Term Futures (SVXY) – before even thinking about fading volatility. I am increasingly wary of the on-going downtrend in SVXY marked by its declining 20DMA.
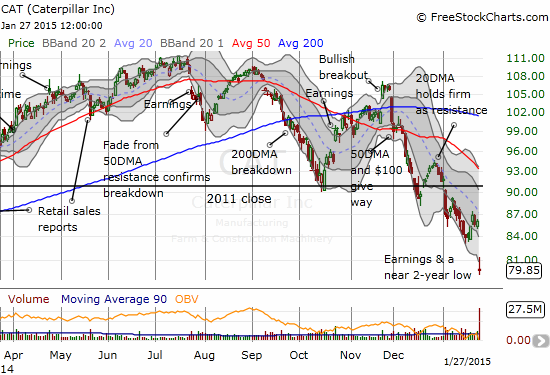
One of the Dow components causing trouble today was Caterpillar, Inc. (CAT). Apparently, plunging oil prices have caused serious challenges for CAT’s oil-based business. I think the following bullets points from Seeking Alpha speak volumes, especially the last point!
- The oil price decline is the most significant reason Caterpillar (NYSE:CAT) expects a 20% cut in its earnings this year, particularly for its energy and transportation unit which makes compressors, pumps and turbines for oil and natural-gas companies, and is a negative for CAT’s construction business in oil-producing regions, CEO Doug Oberhelman said in today’s earnings call.
- A stronger dollar also is hurting sales and will hurt U.S. manufacturers, although CAT’s global production footprint would help offset the impact, the CEO said.
- “We are hopeful the guidance is conservative enough to provide a base level expectation for 2015, but it was a surprise even against lower expectations,” says William Blair analyst Larry De Maria.
- If 2015 sales fall the company expects, it would be the first time since the Great Depression that CAT has experienced three consecutive years of falling revenues.
While I have been bearish on CAT since its breakdown in early December, I did not have my favorite hedge in place before earnings (a basket full of CAT puts). The small bounce ahead of earnings actually qualified for a fade, but I was being conservative in looking for a larger bounce. I have also been distracted by the market’s resilience in the face of CAT’s decline. I think of CAT as one of several indicators of market health, so the extended duration of the widening divergence between CAT and the S&P 500 is throwing my mental model for a bit of a loop. In other words, is the S&P 500 due for a major fall or will CAT instead soon launch a healthy relief rally?
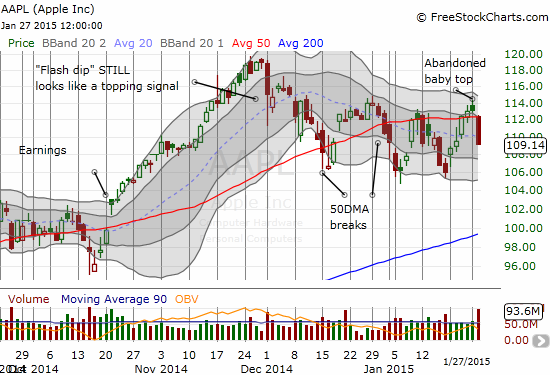
Apple (AAPL) experienced sympathy selling that created less than ideal conditions for the quarterly pre-earnings trade (click the link for more details on the setup). My analysis concluded a bearish response to earnings was the most likely outcome. I bought a weekly put and a put spread expiring next week. My idea was to provide the opportunity to profit greatly from a big decline and also to be ready for a slow drip downward.
At the time of my positioning, AAPL was “only” down 1.6% or so. By the close, AAPL was down 3.5%. This was definitely enough to qualify for profit-taking on the put option, but my limit sell order was set just a little too high. I will pay the price for relying on that setting to take advantage of a plunge into the close as AAPL produced gangbuster numbers for earnings. HOWEVER, the stock “only” managed in after hours to close today’s gap down. AAPL needs to close ABOVE $114.50 to invalidate the topping pattern from the abandoned baby top (see chart below). More importantly, AAPL needs to gain some immediate follow-through to finally break through the bearish build-up I discussed in the pre-earnings analysis. I am also VERY wary of the extremes in optimism I now see in the stock.
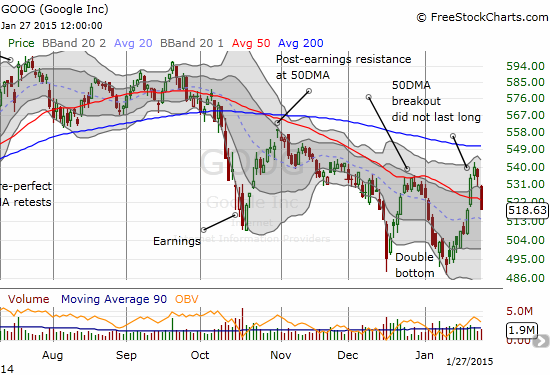
The sympathy selling in tech was also enough to bring Google’s (GOOG) spirited rally off recent lows to an abrupt halt. GOOG reports earnings on Thursday, Jan 29th. I do not have a GOOG-specific model for playing earnings ahead of time, but I will be primed to trade GOOG AFTER earnings.
Daily T2108 vs the S&P 500
")
Black line: T2108 (measured on the right); Green line: S&P 500 (for comparative purposes)
Red line: T2108 Overbought (70%); Blue line: T2108 Oversold (20%)
Weekly T2108

*All charts created using freestockcharts.com unless otherwise stated
The T2108 Resource Page
Expanded daily chart of T2108 versus the S&P 500
Expanded weekly chart of T2108
Be careful out there!
Full disclosure: long AAPL put and put spread