
(T2108 measures the percentage of stocks trading above their respective 40-day moving averages [DMAs]. It helps to identify extremes in market sentiment that are likely to reverse. To learn more about it, see my T2108 Resource Page. You can follow real-time T2108 commentary on twitter using the #T2108 hashtag. T2108-related trades and other trades are sometimes posted on twitter using the #120trade hashtag. T2107 measures the percentage of stocks trading above their respective 200DMAs)
T2108 Status: 54.1%
T2107 Status: 48.2%
VIX Status: 14.2 (a 20% jump!)
General (Short-term) Trading Call: Start selling bullish positions. Aggressive bears can open fresh shorts.
Active T2108 periods: Day #35 over 20%, Day #33 over 30%, Day #30 over 40%, Day #28 over 50% (overperiod), Day #3 under 60% (underperiod), Day #105 under 70%
Reference Charts (click for view of last 6 months from Stockcharts.com):
S&P 500 or SPY
SDS (ProShares UltraShort S&P500)
U.S. Dollar Index (volatility index)
EEM (iShares MSCI Emerging Markets)
VIX (volatility index)
VXX (iPath S&P 500 VIX Short-Term Futures ETN)
EWG (iShares MSCI Germany Index Fund)
CAT (Caterpillar).
Commentary
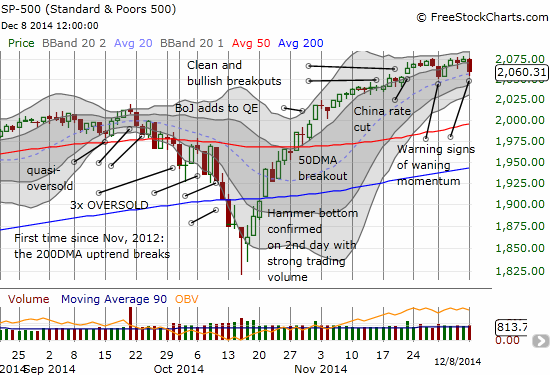
“I am bullish yet even *I* am surprised to see the S&P 500 (SPY) already printing a fresh all-time high. Just two days ago, I was bracing for bearish follow-through selling to a topping pattern. Instead, sellers absolutely failed to capture the imagination of the market as buyers went right back to work snapping up early holiday season ‘bargains.'”
This is how I began the last T2108 Update. It turns out that the bears are not going away THAT easy after all. The stubborn bears have come a-knocking again – this time with even more convincing insistence.
Trading this week started with many more ominous signals than I saw last week. As a result, I am more wary than ever about the sustainability of the market’s current momentum. Let’s dive right in with the charts.
T2108 closed at 54.1%. This was a significant loss of 4.5 percentage points in a move that confirms T2108’s failure to sustain overbought levels. As a reminder, I consider such a rejection “good enough” to flag topping conditions in the market.
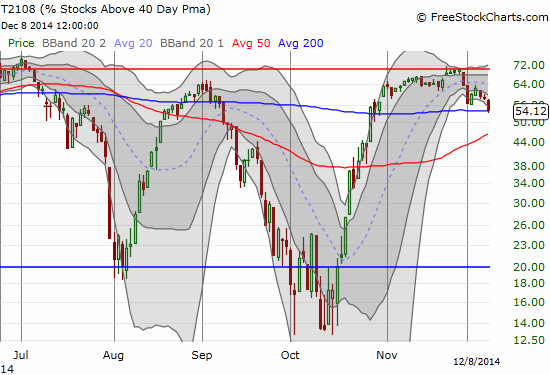
It is a good thing we have T2108 to give us the early warning signal. Without it, the current sagging and waning of momentum in the S&P 500 (SPY) may not appear ominous at all. The 20DMA still holds as an uptrend line, and the market has yet to follow through on its closure of the gap up from the surprise China rate cut. Moreover, the index only lost 0.7% and is similarly just that far away from a fresh closing all-time high.
A huge 20% jump in the volatility index is adding to the warning bells.
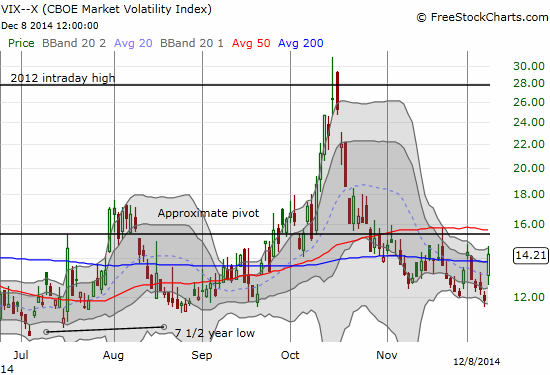
I sometimes pounce on these kinds of volatility spikes to start a fade when I am bullish. But I stopped short because of the accumulation of bearish signals. When the VIX was up 10% on the day, I made the following observation:
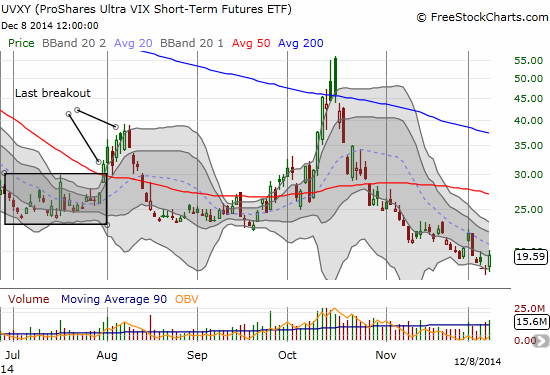
Surprisingly small response in $UVXY to today's #VIX spike.
— Dr. Duru (@DrDuru) December 8, 2014
It suddenly occurred to me that this was one of those RARE moments where I observed an inefficiency before the market resolved it. I rushed to buy call options on ProShares Ultra VIX Short-Term Futures (UVXY). Sure enough, they ended up about 61% on the day as UVXY closed with a 7.2% gain. As an example of my wariness, I did not take the quick profits even as my trading rules for options typically dictate taking such profits right off the table. I cannot imagine UVXY sustaining momentum all week though, so I doubt I will be holding the position past this week.
Another example of my growing wariness? Caterpillar (CAT) hit my downside target at $95, and I did NOT close out my put spread. This put spread is a hedge on my overall bullishness, and it delivered bigtime today. The position still has another month of life, so I can afford to be a little more patient. CAT made a VERY bearish extension of its 50DMA breakdown. It has now effectively closed its post-earnings gap up from two months ago. It is also well below its lower-Bollinger Band (BB). I will not be surprised to see a (dead-cat) bounce (pun sorta intended). I have no problem sitting on the put spread right through such a move.
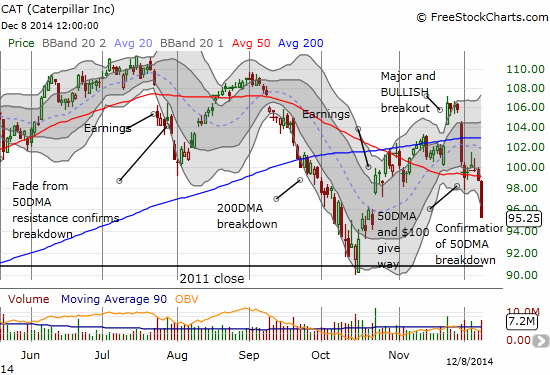
Quick sidebar – at the time of writing, I saw the following tweet that gave me even more urgency to get this T2108 Update published. It certainly bodes poorly for stocks like CAT in the Tuesday trading session! If CAT extends lower, I will sell the put spread as additional upside becomes too small to be worth the risk of holding.
Shanghai Composite Index is down 6.0% at 2837.69. http://t.co/4euSXR3Agm
— WSJ Breaking News (@WSJbreakingnews) December 9, 2014
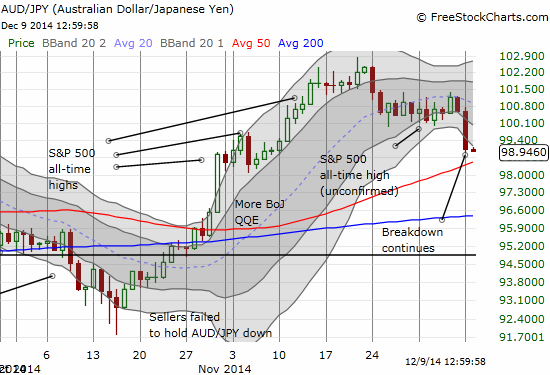
So those bearish signals are STILL not enough for you? Let me introdue you to my other reliable friend the Australian dollar (FXA). In overnight trading, the Australian dollar extended its breakdown against the Japanese yen (FXY). As a reminder, AUD/JPY has served as relatively reliable leading indicator or confirming signal on the way up and down. It is warning of more downside immediately ahead just as it refused to confirm the last S&P 500 all-time highs.
Even I could find some charts of encouragement, I would not post them. I do not want to get distracted with “hope” right now. This is a time to process what is directly in front of the trading screen.
I am still holding my long-standing shares in ProShares Ultra S&P500 (SSO). I will have to exit if the S&P 500 closes lower as it would confirm the end of the immediate momentum. Aggressive bears can already start fresh shorts here. Stops can be placed a little higher than all-time highs so as to avoid whiplash (notice that new highs have come on very marginal moves lately). Bulls should be taking SOME profits as a “just in case,” especially if you are not hedged. Note well, that I am NOT suddenly turning bearish. Let’s call it “protective.” I am still expecting a lot of chop from here until year-end. A major breakdown, for example below the 50DMA, will force me to reassess.
I conclude with some other charts that have me worried or at least are not helping my mood: Apple (AAPL), Best Buy (BBY), Baidu (BIDU), Tesla (TSLA), and Alibaba (BABA).
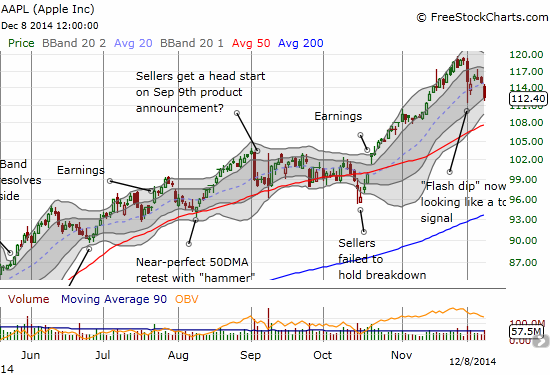
I earlier took AAPL’s “flash dip” in stride and assumed this would prove to be a blip on the way to ever higher prices. The continued weakness is concerning and leaves AAPL just a hair away from confirming a topping signal with a close below the low of the flash dip. I went into Monday with an active call option position and I happily took the discount at the opening to add to the position. When it paid off with a small gain in rapid order, I closed out the new position. The image of watching profits fade from last week’s flash dip buying is simply too fresh. The sale proved timely as later in the day a limit order at lower prices triggered. The Apple Trading Model (ATM) is marginally predicting upside for Tuesday. I will be wise to close out this position if the market cooperates with the model.
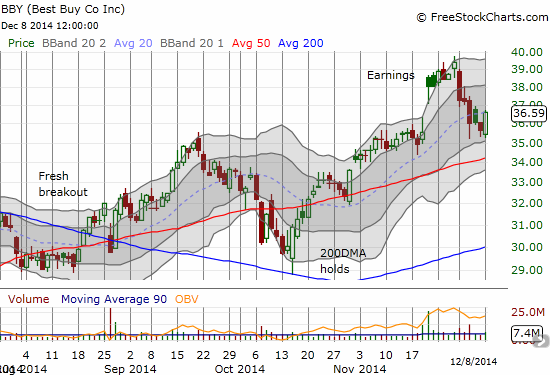
BBY SHOULD be an encouraging chart given the upward trend supported by the 50DMA. However, with a different lens, I see it as another stock that is proving it cannot sustain current heights. The fill of the earnings gap is bearish, and the reflexive buying changes little. I am watching to see whether BBY can hold its 50DMA support long enough to resume upward momentum.
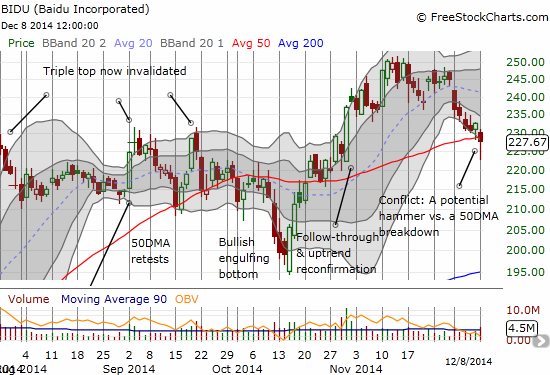
I went into this week bullishly expecting BIDU to bounce from its 50DMA support. Instead, it took a deep plunge below this important line of support. The stock made a spirited comeback into the close that has formed a bottoming hammer pattern. I normally would be encouraged by this action, but now I need to see some follow-through buying. I am also seeing a growing downtrend between the lower Bollinger Bands (BBs) that has developed from December 1st’s breakdown below the 20DMA.
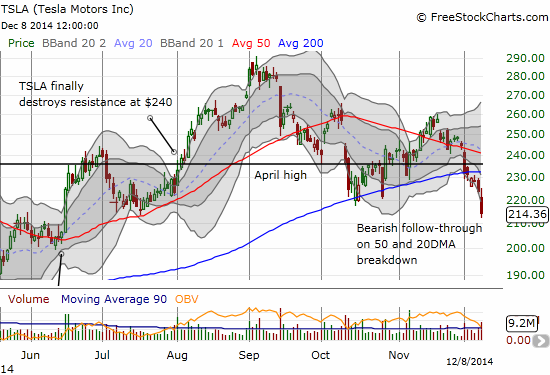
I was actually prepared for the breakdown TSLA is now confirming. The stock has enjoyed nearly unquestioned support from a technical standpoint, but the breakdown that began last week was ominous. Volume rose on the double breakdown from the 50DMA and 200DMA, and it rose today on the confirming follow-through. The damage can of course be repaired by a rally that takes the stock above the 200DMA again. Until then, this is looking like a broken momentum stock and adds to the bearish signals looming overhead.
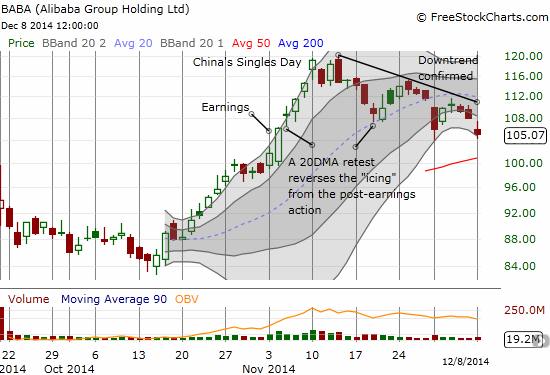
The downtrend from all-time highs has extended further on BABA. This stock continues to be an avoid until that downtrend breaks or MAYBE on a retest of $100 and/or the nascent 50DMA. Needless to say, the Ali Rah Rah pop is losing steam even as the S&P 500 has out-performed BABA for the past month.
Daily T2108 vs the S&P 500
")
Black line: T2108 (measured on the right); Green line: S&P 500 (for comparative purposes)
Red line: T2108 Overbought (70%); Blue line: T2108 Oversold (20%)
Weekly T2108

*All charts created using freestockcharts.com unless otherwise stated
The T2108 Resource Page
Expanded daily chart of T2108 versus the S&P 500
Expanded weekly chart of T2108
Be careful out there!
Full disclosure: long SSO shares; long put spread on CAT; long call options on BIDU; short TSLA; net short the Australian dollar; long UVXY put options