
(T2108 measures the percentage of stocks trading above their respective 40-day moving averages [DMAs]. It helps to identify extremes in market sentiment that are likely to reverse. To learn more about it, see my T2108 Resource Page. You can follow real-time T2108 commentary on twitter using the #T2108 hashtag. T2108-related trades and other trades are sometimes posted on twitter using the #120trade hashtag. T2107 measures the percentage of stocks trading above their respective 200DMAs)
T2108 Status: 62.2% (2-day decline of 20% qualifies for quasi-oversold status)
T2107 Status: 52.0%
VIX Status: 12.5
General (Short-term) Trading Call: Hold bullish positions. Aggressive bears should have stopped out on fresh all-time highs. (That is the risk you take here!)
Active T2108 periods: Day #32 over 20%, Day #30 over 30%, Day #27 over 40%, Day #25 over 50%, Day #1 over 60%, Day #102 under 70%
Reference Charts (click for view of last 6 months from Stockcharts.com):
S&P 500 or SPY
SDS (ProShares UltraShort S&P500)
U.S. Dollar Index (volatility index)
EEM (iShares MSCI Emerging Markets)
VIX (volatility index)
VXX (iPath S&P 500 VIX Short-Term Futures ETN)
EWG (iShares MSCI Germany Index Fund)
CAT (Caterpillar).
Commentary
I am bullish yet even *I* am surprised to see the S&P 500 (SPY) already printing a fresh all-time high. Just two days ago, I was bracing for bearish follow-through selling to a topping pattern. Instead, sellers absolutely failed to capture the imagination of the market as buyers went right back to work snapping up early holiday season “bargains.”
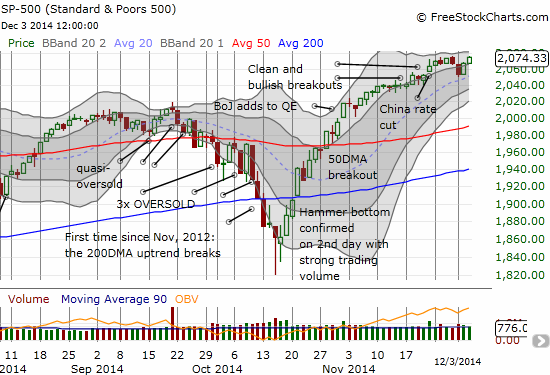
Even Caterpillar (CAT) shocked me by jumping above $100 before hitting my lower price target first. Although the stock faded hard from its high of the day, CAT still put on a convincing enough show to suggest the 50DMA will be support for now.
The S&P 500’s latest celebration was preceded by a big blowback in the volatility index. The VIX dropped 10% and similarly sent ProShares Ultra VIX Short-Term Futures (UVXY) tumbling downward 11.2%. Needless to say, I took my profits on the put options I discussed in the last T2108 Update. With the help of some hindsight, that fresh plunge in the VIX becomes a telling signal for and strong precedence for the new all-time high.
My other two trades of the week remind me that it is difficult to use individual stocks to play expectations on the S&P 500. Amazon.com (AMZN) held up well at the 200DMA yesterday but swooshed again today for a 3.0% loss. I stayed stubborn and pulled the trigger on one more call option as AMZN bounced from its 50DMA. The weakness in Baidu (BIDU) continued and looks ominous enough that I decided to switch my bias to bearish and a 50DMA retest.
Most interesting in this quick snapback for the S&P 500 is that T2108 notably lagged. My favorite technical indicator failed to retest the overbought threshold at 70% and sits a full 8 percentage points below. This indicates that the index has left some stocks behind…like AMZN and probably a whole host of energy-related plays. The optimistic way to interpret the quasi-divergence is that the S&P 500 now has plenty of upside to go.
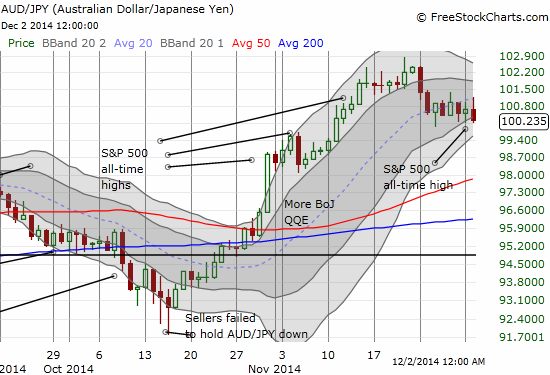
Note however that my favorite confirmation signal in the currency market is lagging in a bad way. The Australian dollar (FXA) is barely holding 100 against the Japanese yen (FXY) and could easily swoon to retest the 50DMA. This would be a MAJOR non-confirming signal if the S&P 500 continues to pull higher. I am watching this action even more closely now. This week contained a LOT of important economic news for the Australian dollar. I hope to produce a summary by the end of the week.
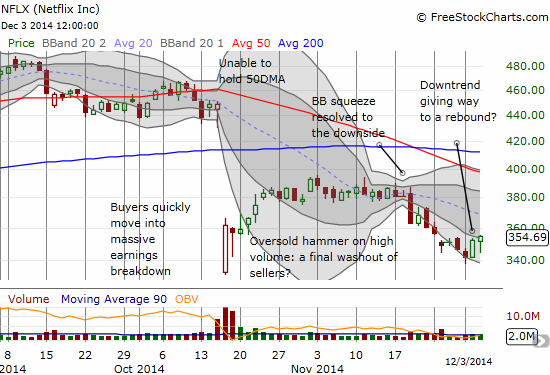
Regardless, failing follow-through selling to confirm the previous topping pattern, I am still happily holding onto my shares in ProShares Ultra S&P500 (SSO). My recommendation for bears is that you should have stopped out of new shorts that were taken based on the bearish topping pattern. That pattern was effectively invalidated by today’s fresh all-time high. Even Netflix is showing signs of life again as the neat downtrend channel formed by the lower-Bollinger Bands is starting to give way…
Daily T2108 vs the S&P 500
")
Black line: T2108 (measured on the right); Green line: S&P 500 (for comparative purposes)
Red line: T2108 Overbought (70%); Blue line: T2108 Oversold (20%)
Weekly T2108

*All charts created using freestockcharts.com unless otherwise stated
The T2108 Resource Page
Expanded daily chart of T2108 versus the S&P 500
Expanded weekly chart of T2108
Be careful out there!
Full disclosure: long SSO shares; long put spread on CAT; long call options on AMZN, BIDU; long put options on BIDU; Long puts and a put spread on NFLX.