
(T2108 measures the percentage of stocks trading above their respective 40-day moving averages [DMAs]. It helps to identify extremes in market sentiment that are likely to reverse. To learn more about it, see my T2108 Resource Page. You can follow real-time T2108 commentary on twitter using the #T2108 hashtag. T2108-related trades and other trades are sometimes posted on twitter using the #120trade hashtag. T2107 measures the percentage of stocks trading above their respective 200DMAs)
T2108 Status: 65.1%
T2107 Status: 53.2%
VIX Status: 12.7 (fresh 2-month closing low)
General (Short-term) Trading Call: Hold (bullish positions)
Active T2108 periods: Day #16 over 20%, Day #14 over 30%, Day #11 over 40%, Day #9 over 50%, Day #4 over 60%, Day #86 under 70%
Reference Charts (click for view of last 6 months from Stockcharts.com):
S&P 500 or SPY
SDS (ProShares UltraShort S&P500)
U.S. Dollar Index (volatility index)
EEM (iShares MSCI Emerging Markets)
VIX (volatility index)
VXX (iPath S&P 500 VIX Short-Term Futures ETN)
EWG (iShares MSCI Germany Index Fund)
CAT (Caterpillar).
Commentary
Going into and during the October sell-off, bears were fond of noting that the top in the S&P 500 (at the time) coincided with the IPO of Alibaba (BABA). It was a neat and convenient story of buyer’s exhaustion and a peak in complacency. I saw this milestone called the “Ali Blah Blah” top on twitter. Now that BABA is making fresh all-time highs day after day, I am wondering whether these same bears are leveraging this nifty technical signal to either get out of the way of the uptrend or hop aboard.
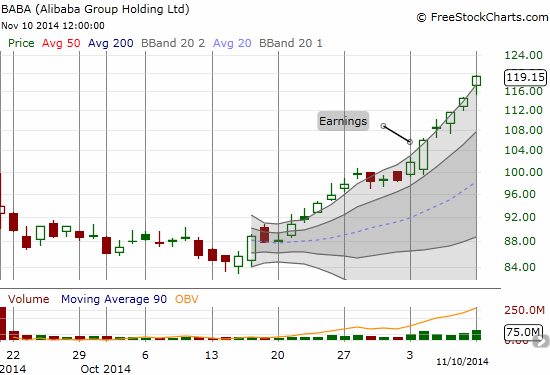
The BABA uptrend is quite impressive, strong and persistent. I really missed big on that one. The Ali Blah Blah top has turned into what I will now call the “Ali Rah Rah pop” until the name no longer applies. The Ali Rah Rah pop now features a resumption of upward momentum that seems unperturbed by the jeers and derision of market detractors who keep calling for a market top with each step higher. The S&P 500 is oblivious to scandalized bears and is instead blithely pushing along to the “rah rah” cheers of the momentum and trend-following crowd.
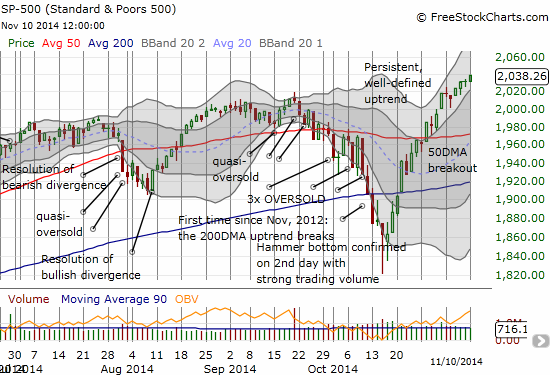
T2108 is also trundling along higher. At 65.1%, T2108 is just barely higher than it was a week ago. My favorite technical indicator is starting to make me wonder whether a coiled spring is getting ready to pop. Either way, overbought conditions seem almost certain at some point in the coming days (I was hoping for overbought to coincide with Friday’s jobs report). However, if T2108 takes a notable dive before returning to overbought conditions, I will stand up and take notice given this is exactly how the selling in September began. A descent below the 60% level might make me give the bearish case more serious consideration.
Volatility continues its descent. The volatility index, the VIX, has essentially completed a roundtrip from late September’s breakout that came the trading day after (Monday, September 22) the BABA IPO. Funny how these things can seem so interconnected.
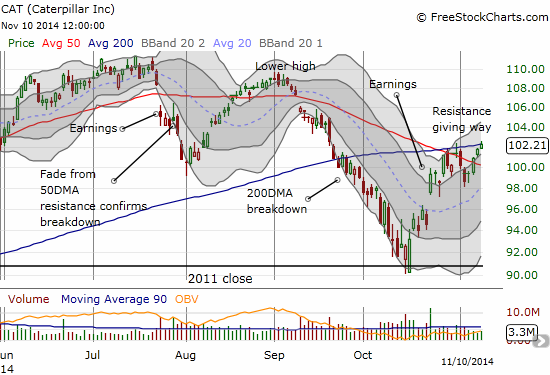
Caterpillar (CAT), my favorite bulldozer in the coal mine, may have the “final” say on whether we go breakout or go bust from here. Surprisingly, it is already pushing against resistance at the 200DMA and now looks ready to break out higher. Just as I could not get with the bearish program with transports pushing bullishly higher, a CAT bulldozing higher simply fortifies my bullishness on the market. CAT is also my favorite hedge on bullish sympathies, so I will still look for an opportunity to rebuild put options “just in case.”
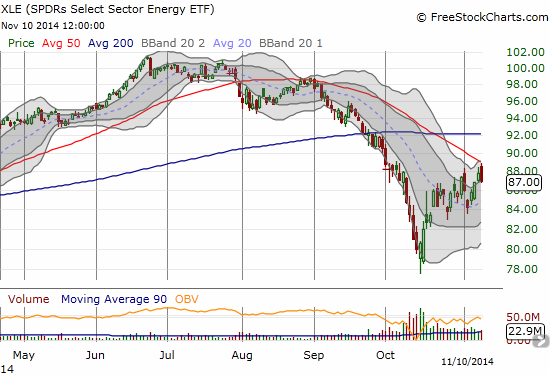
Finally, in trading action, I sold my call options on Baidu (BIDU) into today’s very cooperative 4.7% move off support from the first Bollinger Band (click here to see the discussion of this setup). The options essentially doubled off this one move – a great reminder of what I love about trading options for short-term positioning. I also shorted Energy Select Sector SPDR ETF (XLE) as it faded off 50DMA resistance. This is NOT a hedge, just a trade following very simple technical rules…
Daily T2108 vs the S&P 500
")
Black line: T2108 (measured on the right); Green line: S&P 500 (for comparative purposes)
Red line: T2108 Overbought (70%); Blue line: T2108 Oversold (20%)
Weekly T2108

*All charts created using freestockcharts.com unless otherwise stated
The T2108 Resource Page
Expanded daily chart of T2108 versus the S&P 500
Expanded weekly chart of T2108
Be careful out there!
Full disclosure: long SSO shares and call options, short XLE, long CAT put options