
(T2108 measures the percentage of stocks trading above their respective 40-day moving averages [DMAs]. It helps to identify extremes in market sentiment that are likely to reverse. To learn more about it, see my T2108 Resource Page. You can follow real-time T2108 commentary on twitter using the #T2108 hashtag. T2108-related trades and other trades are sometimes posted on twitter using the #120trade hashtag. T2107 measures the percentage of stocks trading above their respective 200DMAs)
T2108 Status: 21.1% (ends 2-day oversold period)
T2107 Status: 41.8%
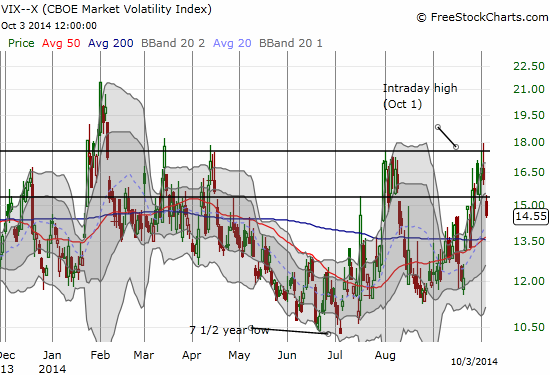
VIX Status: 14.6 (drop of 10% below 15.35 pivot)
General (Short-term) Trading Call: Hold longs, “conservative” T2108 traders can buy with major caveats discussed below, remaining shorts should be closed if/once S&P 500 and/or the NASDAQ close above 50DMA. More details and caveats below.
Active T2108 periods: Day #1 over 20% (ended 2-day oversold period which in turn ended 319 days over 20%), Day #9 under 30%, Day #15 under 40%, Day #17 under 50%, Day #19 under 60%, Day #61 under 70%
Reference Charts (click for view of last 6 months from Stockcharts.com):
S&P 500 or SPY
SDS (ProShares UltraShort S&P500)
U.S. Dollar Index (volatility index)
EEM (iShares MSCI Emerging Markets)
VIX (volatility index)
VXX (iPath S&P 500 VIX Short-Term Futures ETN)
EWG (iShares MSCI Germany Index Fund)
CAT (Caterpillar).
Commentary
While most of the financial media focuses on how the U.S. jobs report presumably drove a major recovery in the indices, T2108 follower know better. Last week was all about oversold trading conditions.
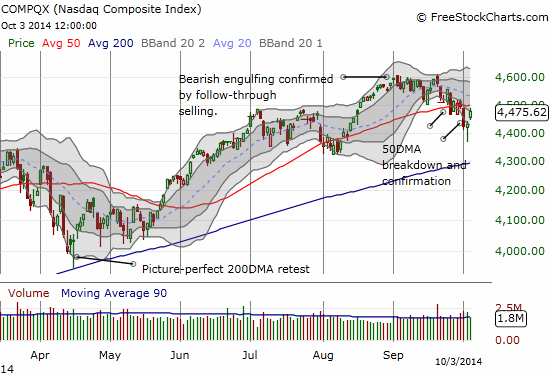
On Thursday, October 2nd, the S&P 500 (SPY) plunged again well below its lower-Bollinger Band (BB). Unlike the day before, buyers rushed in. T2108 dropped as low as 13.0% before buyers punched in the bottom. The resulting rush was enough to close the S&P 500 flat on the second day of the oversold period. The oversold period ended with a nice buying surge that took the S&P 500, and the NASDAQ, close to 50DMA resistance.
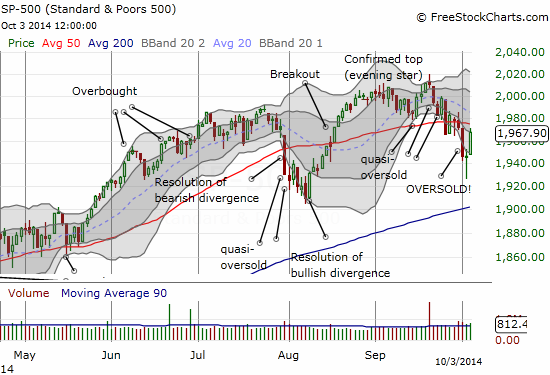
The looming overhead resistance will be the immediate challenge for bulls next week. However, I strongly suspect that enough bears and sellers were caught chasing stocks and the indices downward too far, and enough buyers and bulls were caught unprepared to buy into the surge of negativity, that Monday could deliver a clean gap up to and/or above the 50DMA resistance. This gap up could be caused by an abrupt shift in sentiment that can come with some thinking time over the weekend. Even if the gap up does not deliver, the advantage is now firmly back in the court of the bulls with a clear stop at the low of the last oversold period.
The VIX action is even more telling. As I mentioned in the last T2108 update, I like to see a surge in the VIX during an oversold period that takes it to or past the previous high. This round did not disappoint. The VIX surpassed the last high and soon thereafter reversed in a wave of buying that followed. That was a great time for me to pick up my second tranche of ProShares Ultra S&P500 (SSO) call options. The peak in volatility was all but confirmed with Friday’s gap down below the 15.35 pivot point.
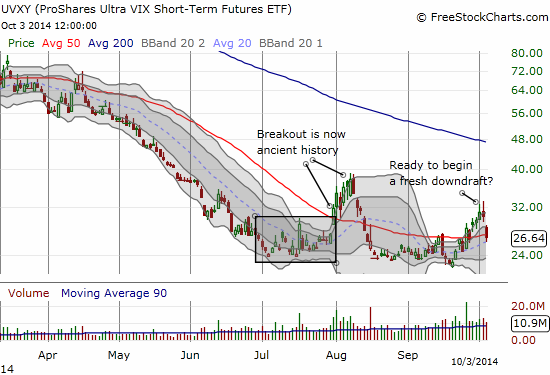
That peak in volatility was also a great time to load up on puts on ProShares Ultra VIX Short-Term Futures (UVXY). As I noted in the last T2108 Update it looked like UVXY was peaking even as T2108 first plunged into oversold conditions.
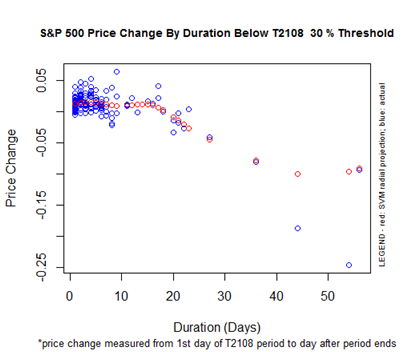
The timing of the oversold period worked out well too. As I reminded readers in the last T2108 Update, the median oversold period lasts 2 to 3 days; this one lasted 2 days. Next up is the time ticking on the 30% underperiod which has a median duration of 6 days and average of 7. This current 30% underperiod has now lasted 9 days and counting. Here is a look at the projected performance for the S&P when the 30% underpiod ends. Note how expected S&P 500 performs turns negative starting around a duration of 16 days.
Now that the oversold period has ended, more conservative T2108 traders can step in and buy. Underlying this strategy is an assumption that the oversold period marks a significant and important behavior. As I cautioned in the last T2108 Update, the conservative strategy might trigger trade entries just as 50DMA resistance is getting tested. It makes a lot of sense to continue waiting until the indices prove that resistance here will not be a problem.
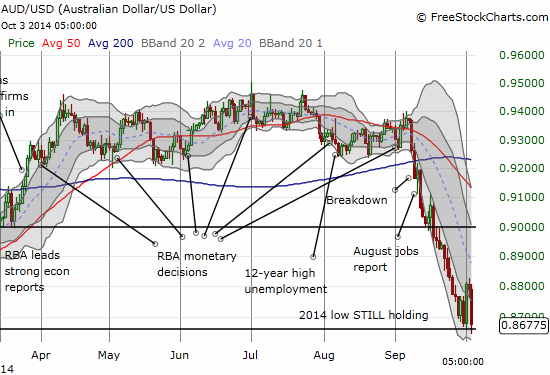
Over in the world of currencies, the Australian dollar just barely hung on for dear life to important support. The ever surging U.S. dollar pushed the Australian dollar back down to and through the 2014 lows. So much for THAT bottom – it was ever so brief. However, AUD/USD just managed to close above the (now) former 2014 low. There is still a glimmer of hope.
More importantly, the Australian dollar versus the Japanese yen (AUD/JPY) is still holding onto 200DMA support.
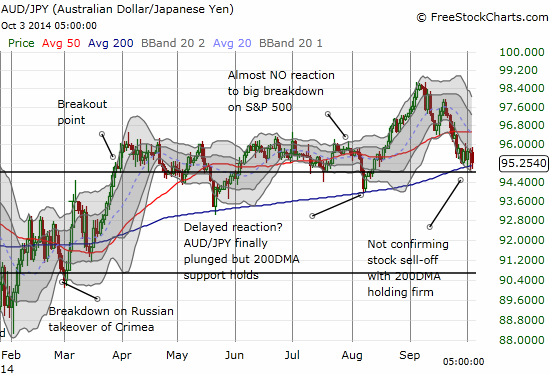
Note well that I am not counting on the Australian dollar to trigger T2108 trades. I like that it confirmed the need to buy into the oversold period. If AUD/JPY breaks down, I will be watching for signs the S&P 500 will follow suit. Since the Australian dollar currently has its own issues with being over-valued, it is very possible that AUD/JPY and the S&P 500 begin a significant period of divergence from here. I will be watching closely.
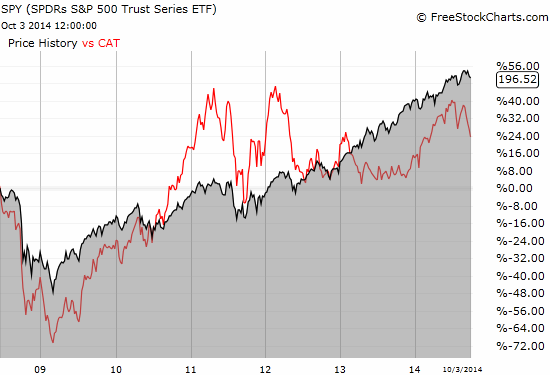
While the T2108 oversold trade worked very well, bulls and buyers cannot yet give the all-clear signal. The topping patterns I have pointed out on the NASDAQ and the S&P 500 are still in play until fresh highs occur. Moreover, Caterpillar (CAT), my favorite hedge on bullish positioning, did not participate in Friday’s rally. After an initial move up, CAT closed the day marginally lower than the previous trading day. This weak behavior is very consistent with my expectation that CAT has no near-term technical support levels beyond a very weak $95 level.
After a very poor relative performance in 2013, CAT spent a good portion of 2014 playing catch-up. See the chart below. The general market has accompanied CAT on the last 2 downlegs, so I am looking over the shoulders of my bullish case very warily at CAT.
Daily T2108 vs the S&P 500
")
Black line: T2108 (measured on the right); Green line: S&P 500 (for comparative purposes)
Red line: T2108 Overbought (70%); Blue line: T2108 Oversold (20%)
Weekly T2108

*All charts created using freestockcharts.com unless otherwise stated
The T2108 Resource Page
Expanded daily chart of T2108 versus the S&P 500
Expanded weekly chart of T2108
Be careful out there!
Full disclosure: net long the Australian dollar, long SSO call options, long UVXY put options