
(T2108 measures the percentage of stocks trading above their respective 40-day moving averages [DMAs]. It helps to identify extremes in market sentiment that are likely to reverse. To learn more about it, see my T2108 Resource Page. You can follow real-time T2108 commentary on twitter using the #T2108 hashtag. T2108-related trades and other trades are posted on twitter using the #120trade hashtag)
T2108 Status: 24.0% (ended 120 days over 40%)
VIX Status: 17.0
General (Short-term) Trading Call: Selective buying for short-term trades. Fade rallies, preferably at or near resistance. Nuances explained below.
Active T2108 periods: Day #269 over 20%, Day #1 under 30% and 40% (underperiods), Day #5 under 50%, Day #16 under 60%, Day #19 under 70%
Reference Charts (click for view of last 6 months from Stockcharts.com):
S&P 500 or SPY
SDS (ProShares UltraShort S&P500)
U.S. Dollar Index (volatility index)
EEM (iShares MSCI Emerging Markets)
VIX (volatility index)
VXX (iPath S&P 500 VIX Short-Term Futures ETN)
EWG (iShares MSCI Germany Index Fund)
CAT (Caterpillar).
Commentary
“The relatively quiet churn in the general market is masking two potentially important developments: an apparent bottoming in volatility and an on-going drop in T2108.” – from my last T2108 Update
This quote reminds me that the market has had plenty of reasons for selling for plenty of days. The title of this T12108 Update is an intentional tongue-in-cheek mocking of conventional media attempts to explain market moves on any given day. The challenge for anyone is to explain why any of these reasons triggered the market move on THIS particular day. From my perch, any catalyst works as a confirmation of the early signals that got me increasingly worried.
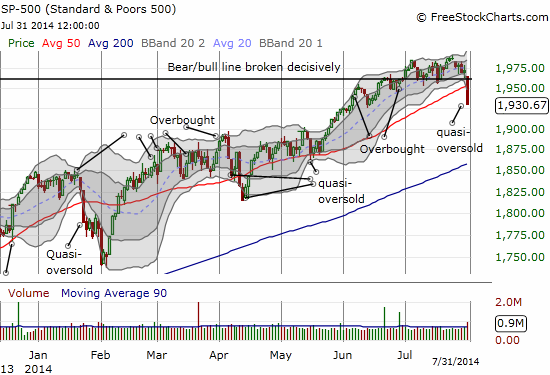
The “quiet divergence” I described in my last T2108 Update turned into a massive breakdown. The S&P 500 dropped 2% in a move that cracked two important technical levels: the bear/bull line at 1962 and the 50-day moving average (DMA).
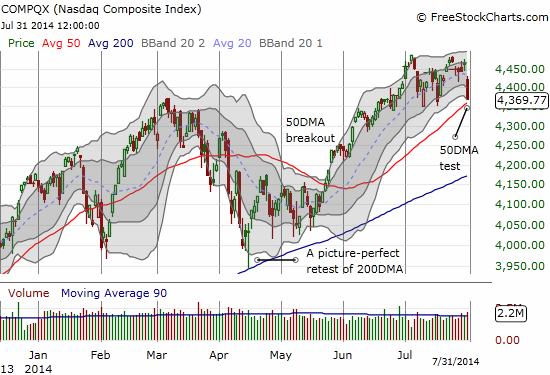
The NASDAQ dropped almost as much as the S&P 500 in percentage terms but it violated no technical boundaries (yet?)…
Leading the way downward was my favorite technical indicator, T2108, the percentage of stocks trading above their respective 40-day moving averages (DMA). T2108 dropped a historic 41%! This one-day change incredibly ranks #23 since 1986!!! Out of the 22 days featuring larger one-day drops, 16 either took T2108 into oversold territory or happened while T2108 was already oversold. This time around, T2108 stopped just short of oversold territory, defined as 20% or below.

With a massive exclamation point, this drop ends the supportive upward trend of higher lows that T2108 produced from the last set of oversold conditions in June, 2013. Thus, the fundamental structure of the market changes from a bullish bias to a bearish one, just like that. Until/unless the S&P 500 hits oversold conditions, my bias will be to fade rallies, preferably at resistance or above upper-Bollinger Bands (BBs). Of course, I wish I was prescient enough to act in ADVANCE of these signals resolving into this sell-off, but I had to stick to the rules and remain patient. The irony now is that the S&P 500 moved so far, so fast, that I had to actually switch to contrarian thinking instead of jumping on the bear bandwagon. Of course these things are never simple, right? Here is a laundry list of significant caveats to getting bearish right here, right now:
- A jobs report tomorrow (Friday, August 1, 2014). It seems like a lose-lose report: strong results remind the market of Fed tightening, weak results will play on the fears suddenly ignited by Thursday’s sell-off. However, it is a major wildcard now to any technical analysis. Is there such a thing as a Goldilocks jobs report? Not too hot? Not too cold?
- An S&P 500 that is over-extended below its lower-Bollinger Band.
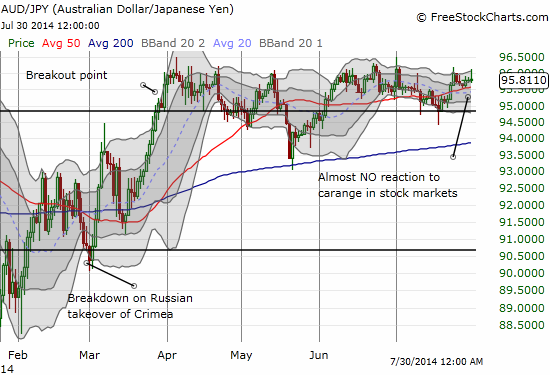
- An Australian dollar (FXA) and Japanese yen (FXY) combination (AUD/JPY) that barely blinked as selling raged in global stock markets. Given the spike in volatility and depth of the selling in stocks, I would have expected AUD/JPY to similarly plunge to confirm fear and a sudden aversion to risk.
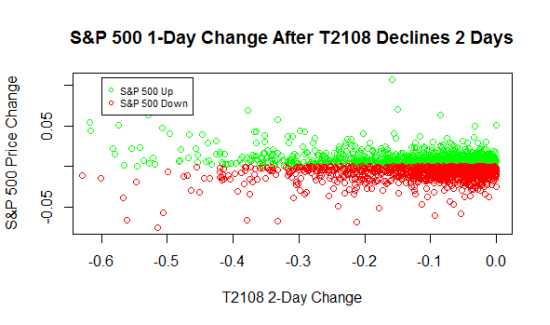
- Quasi-oversold conditions – defined as a 2-day drop in T2108 over a combined 20% (roughly) – that suggest a high likelihood (76% chance) of at least a 1-day bounce Friday (around a 17% classification error rate for predicting an up day). These odds are calculated using the T2108 Trading Model (TTM).
- The next day is a first trading day of the month, historically prone to rallies especially following sell-offs. (Note I have not reconfirmed the data on this in a long time).
Relevant charts below – AUD/JPY and a plot of the S&P 500’s historical 1-day performance after 2-day declines in T2108 (from 1986 to 2013):
Taken together, these items form a laundry list of reasons for NOT chasing anything downward here. Indeed, I decided that T2108’s plunge was close enough to oversold conditions to trade somewhat aggressively: fresh puts to fade ProShares Ultra VIX Short-Term Futures (UVXY) and call options on ProShares Ultra S&P500 (SSO). I left PowerShares QQQ (QQQ) alone figuring that the S&P 500 is poised to bounce first and furthest in an oversold rally. If the selling continues, the S&P 500 becomes even MORE extended while QQQ may “just” retest its 50DMA. In other words, I will just become even more inclined to buy SSO calls on follow-through selling.
After I either sell or give up on these bullish positions, it will be time to appreciate what seems to me a confirmation of the bottoming process I have been monitoring in the VIX, the volatility index. As I have pointed out earlier, a rising VIX does not have to lead to a collapse in the stock market, but it SHOULD mean the swings in the market will get wider.
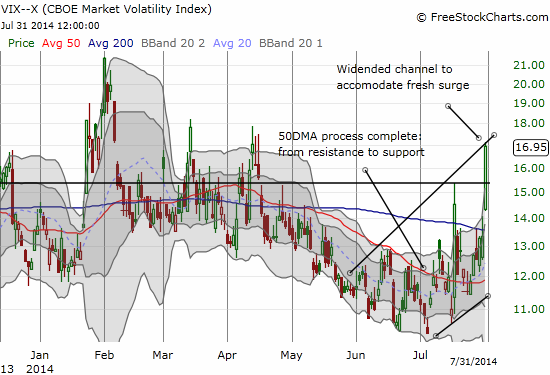
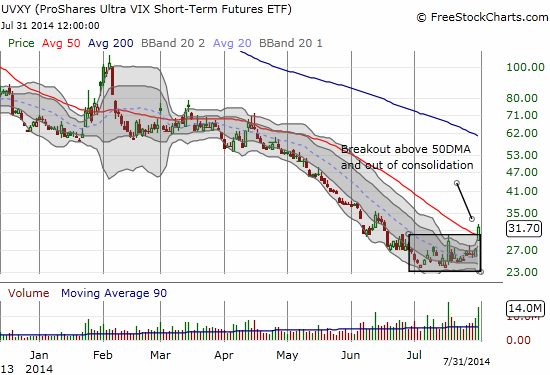
As the VIX bottomed, I pointed out how UVXY was also putting on a rare display of bottoming power. With it jumping 16.7% today, I of course wish I had bought when it failed to pull back post-Fed as expected.
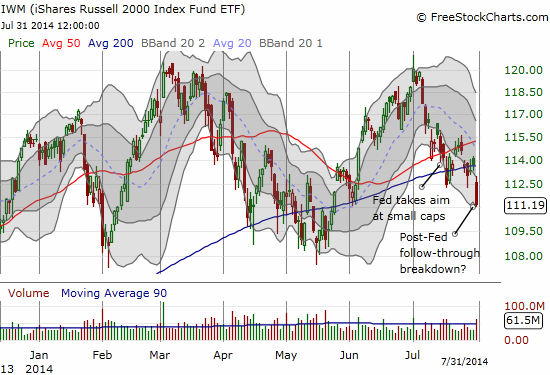
Speaking of the Fed, it looks the pressure it has applied to small caps is working its magic. The iShares Russell 2000 (IWM) is buckling with a fresh breakdown below its 200DMA. Cracking a new low for the year could be a “deathblow.”
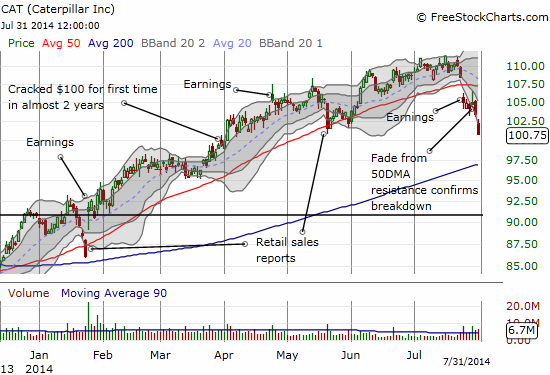
While I did not switch the trade signal in anticipation of today’s trouble, I was not caught unprepared. Regular readers will recall the bright red flag I waved upon the post-earnings breakdown in Caterpillar (CAT). I took full advantage of a retest of 50DMA resistance to rush into a put spread to hedge downside risk. Today’s plunge was so deep that I decided to take profits rather than continue to hold for the little more I could get. I bought a September put spread thinking the hedge would be an extended one.
At least some in the market-sphere were even less prepared than I was to take full advantage of today’s big swoosh downward…from a prediction/guesstimate perspective anyway…
In summary, the fundamental technical structure of the market took a dramatically bearish turn today. It makes me more confident about shorts than longs. The big caveat is that the technical structure could dramatically turn again if T2108 drops into oversold conditions. If so, I would prefer to see a gap down on the S&P 500 on Friday that sucks in overly aggressive bears and shakes out more weak hands. A gap down after extended selling sets up great conditions for a snapback. Combine that with a drop into true oversold territory, and the market generates conditions for the beginning of the end of the selling (aka a bottom). The main strange aspect of oversold conditions here is that the S&P 500 is a mere 3% or so off its all-time high, hardly a discount!
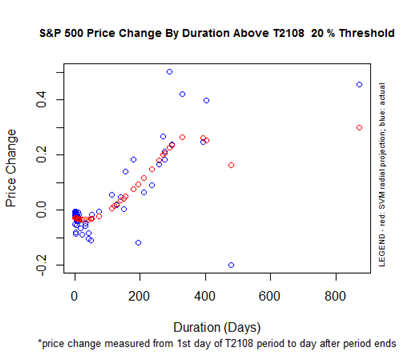
Finally, here is a reminder of the historic downside potential based on the duration of the current 20% overperiod – the number of days T2108 has spent ABOVE 20%. The chart below tells us that the current correction SHOULD be mild overall. The S&P 500 is up 20.4% since it left its last oversold period 269 trading days ago. Almost like magic, that is EXACTLY what the T2108 Trading Model predicts for S&P 500 performance if the 20% overperiod ends tomorrow. You just can’t make this stuff up…
Daily T2108 vs the S&P 500
")
Black line: T2108 (measured on the right); Green line: S&P 500 (for comparative purposes)
Red line: T2108 Overbought (70%); Blue line: T2108 Oversold (20%)
Weekly T2108

*All charts created using freestockcharts.com unless otherwise stated
Related links:
The T2108 Resource Page
Expanded daily chart of T2108 versus the S&P 500
Expanded weekly chart of T2108
Be careful out there!
Full disclosure: long UVXY puts, long SSO call options, long CAT shares