
(T2108 measures the percentage of stocks trading above their respective 40-day moving averages [DMAs]. It helps to identify extremes in market sentiment that are likely to reverse. To learn more about it, see my T2108 Resource Page. You can follow real-time T2108 commentary on twitter using the #T2108 hashtag. T2108-related trades and other trades are posted on twitter using the #120trade hashtag)
T2108 Status: 47.8%
VIX Status: 12.7
General (Short-term) Trading Call: Hold. Bear/bull line remains at 1962. See important developments below.
Active T2108 periods: Day #265 over 20%, Day #117 over 40%, Day #1 under 50% (underperiod), Day #12 under 60%, Day #15 under 70%
Reference Charts (click for view of last 6 months from Stockcharts.com):
S&P 500 or SPY
SDS (ProShares UltraShort S&P500)
U.S. Dollar Index (volatility index)
EEM (iShares MSCI Emerging Markets)
VIX (volatility index)
VXX (iPath S&P 500 VIX Short-Term Futures ETN)
EWG (iShares MSCI Germany Index Fund)
CAT (Caterpillar).
Commentary
On May 12, 2014, I wrote “Volatility Watch” as part of the T2108 Update for that day. At the time, the volatility index, the VIX, had dropped to the bottom of a trading range in place since the beginning of 2013. I was on alert for a bounce even as I acknowledged volatility could go even lower. Volatility obliged and did BOTH. First it bounced 10% or so and then proceed to hit even lower levels. The last closing low was 10.32 on July 2nd. A bounce and a surge later, and I am “incrementally” more convinced that volatility is finally carving out a sustainable low.
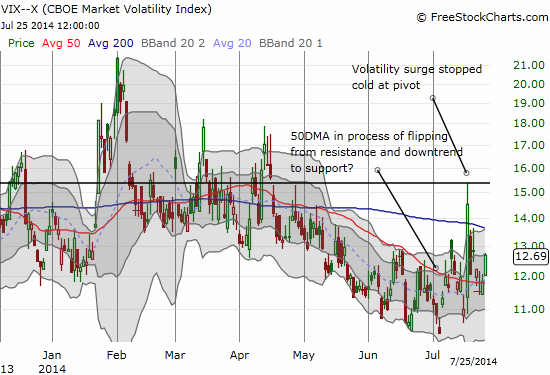
I am now on a second volatility watch, operating on the assumption that a sustainable low has occurred. The 50DMA is looking like a pivot again and as it turns up, the bias for volatility will go upward. Friday’s 7.2% pop seemed to validate my incremental confidence in the low: it was a neat pop over the 50DMA.
As I noted last week, even ProShares Ultra VIX Short-Term Futures (UVXY) seems to be trading differently. I was indeed fortunate to lock in profits on my latest round of UVXY puts as it failed to break the low of the huge surge on July 17, 2014.
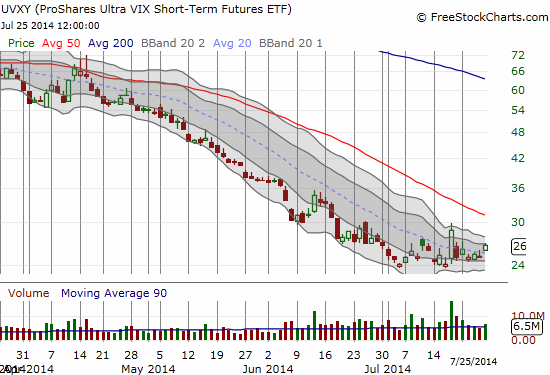
The huge caveat for UVXY and volatility is the Federal Reserve meeting coming up Wednesday, July 30th. I have noted recently how these meetings tend to dampen volatility, especially if it has spiked going into the meeting. Although I have yet to verify this casual observation with a review of the historical data, I am guessing the same will be true this time around. I will look to buy puts on UVXY for one more round. This time of course I will be looking to roundtrip on these puts very quickly.
Another interesting caveat is a convincing technical analysis from Schaeffer’s Investment Research that suggests negativity is already high in the market. It is a good quick read; here are the key bullet points for me:
- Short interest on S&P 500 components is at the 61% percentile as measured over the past 5 years.
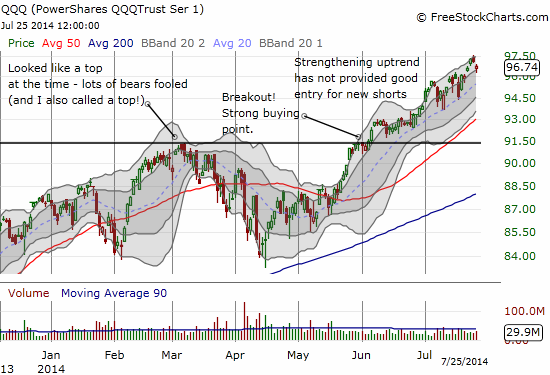
- Short interest on PowerShares QQQ (QQQ) is at the 79% percentile as measured over the past 5 years.
- Call buying remains “heavy” on the CBOE Volatility Index. If this call-buying has become a crowded trade then the VIX is not likely to bottom here. Schaeffer’s points out that these call options serve as hedges that will likely prevent deep selling in the market.
- A Bank of America-Merrill Lynch survey of fund managers indicates heavy weighting in European shares. I pointed how European indices have under-performed the S&P 500 in July. This move is consistent with Schaeffer’s guess that these fund managers will move money from Europe to the U.S.
The point on the high amount of short interest on QQQ is particularly poignant given constant tweets from Doug Kass on accumulating shorts on QQQ (no matter what) as if it is a contrarian move against euphoric trading. These short interest readings are hardly the stuff of euphoria. Instead, tech shorts are in very good company.
I think it is also helpful to remember that the public in general is not paying much attention to the stock market: stock ownership on a global basis is at its lowest level since 1959 when measurements began. As I have heard elsewhere, the current bull market could be one of the most hated in history.
On the other hand, Schaeffer’s reminds us that August and September tend to be the weakest months of the year, on average. You can see something similar in my “Buy In July” piece.

In other words, August and September provide plenty of fodder for an increase in the VIX and an accompanying sell-off. Overall, Schaeffer is suggesting that the dips over the next two months should be bought because it is not likely the market has topped out yet. I think T2108 should provide a relatively good guide for these trades with quasi-oversold conditions or just the mere fact it is “close enough” to true oversold conditions relative to past dips.
On Friday, T2108 closed at 47.8% as the S&P 500 (SPY) dipped -0.48%. The 20DMA uptrend remains intact and the bear/bull line at 1962 is still “safe” with the S&P 500 trading at 1978.34.
Above all, remember that the S&P 500 can trade higher even as the market increases its estimate of the likelihood for a 10% pullback. See below how these odds bottomed around 2005…
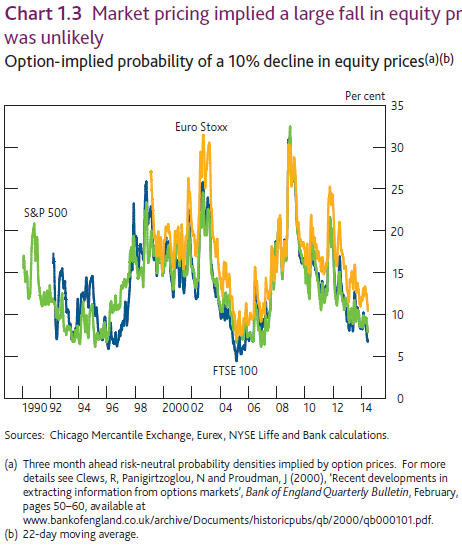
Source: Bank of England June, 2014 Financial Stability Report
Daily T2108 vs the S&P 500
")
Black line: T2108 (measured on the right); Green line: S&P 500 (for comparative purposes)
Red line: T2108 Overbought (70%); Blue line: T2108 Oversold (20%)
Weekly T2108

*All charts created using freestockcharts.com unless otherwise stated
Related links:
The T2108 Resource Page
Expanded daily chart of T2108 versus the S&P 500
Expanded weekly chart of T2108
Be careful out there!
Full disclosure: no positions