
(T2108 measures the percentage of stocks trading above their respective 40-day moving averages [DMAs]. It helps to identify extremes in market sentiment that are likely to reverse. To learn more about it, see my T2108 Resource Page. You can follow real-time T2108 commentary on twitter using the #T2108 hashtag. T2108-related trades and other trades are posted on twitter using the #120trade hashtag)
T2108 Status: 56.1%
VIX Status: 12.9tep
General (Short-term) Trading Call: Short (fade rallies, especially in tech).
Active T2108 periods: Day #212 over 20%, Day #64 over 40%, Day #16 over 50% (over-period), Day #20 under 60% (under-period), Day #24 under 70%
Reference Charts (click for view of last 6 months from Stockcharts.com):
S&P 500 or SPY
SDS (ProShares UltraShort S&P500)
U.S. Dollar Index (volatility index)
EEM (iShares MSCI Emerging Markets)
VIX (volatility index)
VXX (iPath S&P 500 VIX Short-Term Futures ETN)
EWG (iShares MSCI Germany Index Fund)
CAT (Caterpillar).
Commentary
Former momentum and otherwise high-flying, expensive stocks continue getting crushed while the general market generally is oblivious and cares little. Informally, this past week witnessed an intriguing combination of brutal sell-offs that look like wash-outs of sellers and important tests of critical support at 200-day moving averages (DMAs). Sorting through the evidence is important given the S&P 500 (SPY) remains locked in a consolidation pattern as the market probes deeper into the legendary month of May (to review my findings on the “sell in May” legend, see “If You Must Sell In May, Choose The Start Or The End Of The Month“).
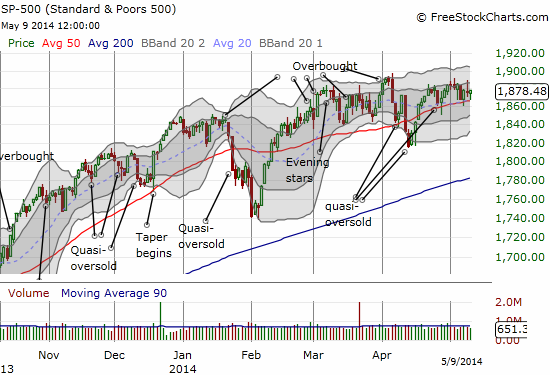
T2108 is just as stuck as the S&P 500. It closed the week at 56.1%, not far from where it closed on April 21, 2014. As I noted in the last T2108 Update, T2108 is not telling us much, except to expect a shallow sell-off if/whenever it comes.
The volatility index, the VIX, is completely unsympathetic to the sell-off in momentum stocks. This makes sense of course since the S&P 500 is showing no concern. The VIX has dropped back to its lows over the past 3+ months. Not even the high beta portion of the S&P 500 has experienced the agony of its momentum cousins.
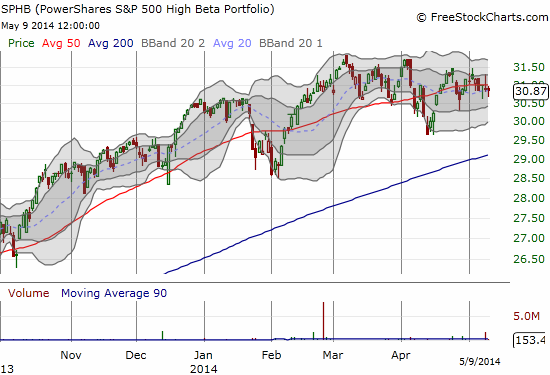
(Note I locked in the profits of my SPHB and SPLV holdings last week under the presumption that it was no longer worth the risk to keep holding them. I am still holding the SSO puts from the pairs trade described in “Momentum Stocks Got You Down? Try A Low-Risk Trade On The S&P 500 For A Change“).
In fact, we have to dig all the way into the Russel 2000 (IWM) to find hints of trouble in a major index. IWM is off about 8% from its recent all-time high.
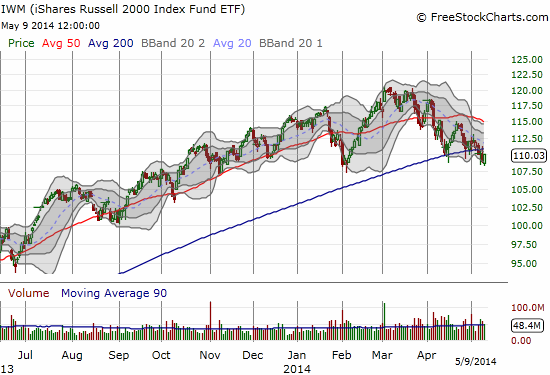
While IWM has broken down below its 200DMA, it has not yet cracked a new low for the year. Such a move would change today’s yellow flag to red. Interestingly, the Russell 1000 is just as serene as the S&P 500.
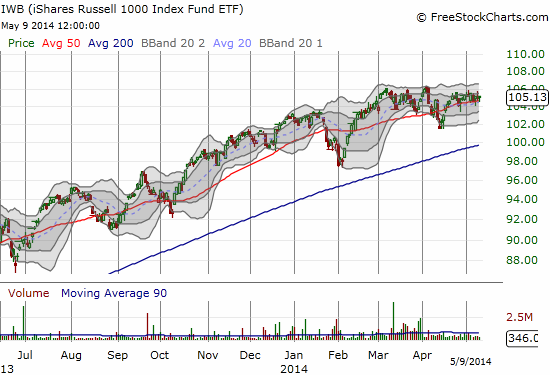
This picture means that the “second” 1000 of the Russell 2000 is carrying the burden of sellers in small-caps. The following weekly chart shows that the divergence in performance between IWM and IWB is a notable event.
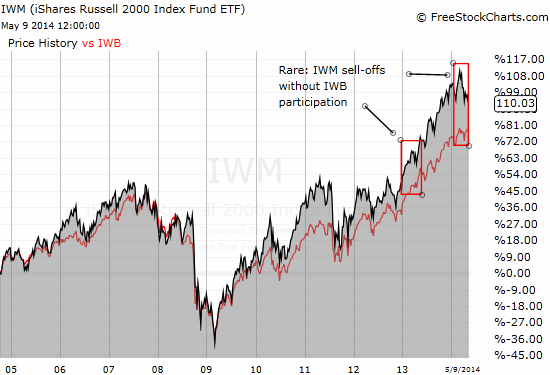
Note that the divergence this spring is an echo from a divergence last year. Otherwise, IWM and IWB have remained largely correlated with each other since at least 2005. The “reversion to the mean” crowd should note that IWM has enjoyed a very long streak of out-performance over IWB. Recent history seems to suggest this stretch MUST end at some point, but no guidance exists for the timing of such a convergence.
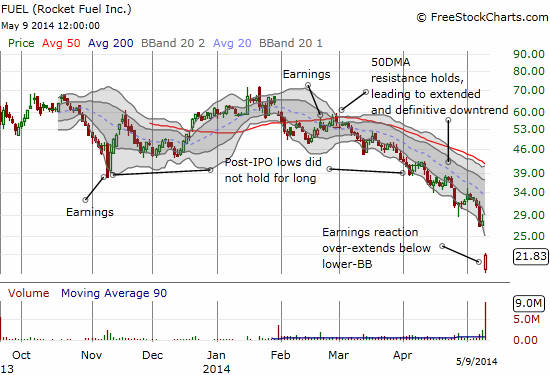
So, is all this apparent complacency the quiet before the storm or an indicator that the sell-off in momentum stocks will finally run its course soon? When I look at the charts, I am apt to believe, surprisingly, that the sell-off is coming to an end sooner than later at least for select momentum/high-flying stocks. What put this thought into my head was the massive post-earnings drop in Rocket Fuel (FUEL), a company that uses predictive modeling to implement data-driven targeting for digital advertising.
Nevermind the convenient name of the company. FUEL reported 95% revenue growth in the previous quarter and “…its ninth consecutive quarter of more than 100% growth in revenue less media costs and gross profit.” FUEL also significantly reduced its net loss from the year ago quarter. The outlook for the year did not even change:
“Looking ahead, we anticipate 62% to 69% revenue growth in the second quarter of 2014 over the second quarter of 2013. This should be viewed in the context of our exceptionally rapid growth of 137% in Q2 of 2013 compared to Q2 of 2012. We are reiterating our 2014 guidance as we expect revenue growth in the latter half of the year to increase slightly from our expected Q2 growth rate due to a number of factors, including the impact of recent sales hiring and expanded offerings that enhance our current product suite.”
So, the crash in the stock likely has a lot to do with a change in sentiment and increasing impatience with a very expensive stock that has delivered pain for most of 2014. (I find it difficult to call this stock a true momentum stock since it essentially topped out right after its first day of trading). Shorts well-anticipated the coming doom and have crowded into this stock. With the stock now below the original IPO price range of $24-27 (the final IPO price was $29), it seems like a good time to cash in. If nothing else, the stock is well below its lower-Bollinger Band (BB). The trading action on Friday suggests that a bounce back to the lower-BB is underway. Valuation is not cheap, but at least it is more “reasonable” at 4x sales and 6x book. The forward P/E of 59 is hard to gauge until the company puts in consecutive quarters of positive earnings.
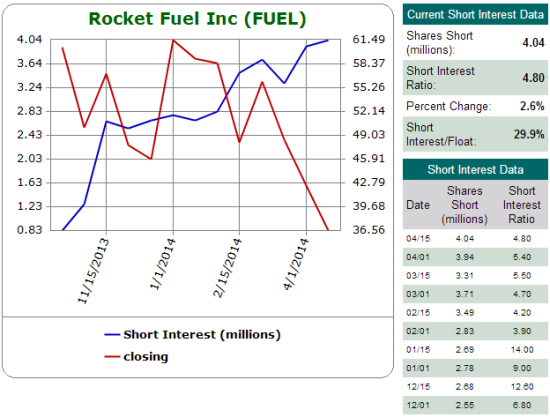
Source: Schaeffer’s Investment Research
If I am correct that FUEL’s sell-off is overdone and some kind of bottom is finally underway, then it makes sense that “bargain shoppers” will start picking through the rubble of other fallen (expensive) tech stocks and hold these names for more than a quick trade. Such signs of life are enough to end the downward momentum across a wide spectrum of the fallen, especially when the serenity in the major indices are providing a backdrop of stability for the overall market.
Note well that I have not yet abandoned my mid-March call for a top in the general stock market. However, the longer the churn continues without a sell-off, I think it becomes increasingly likely that this top is a rest-stop and not a bearish milepost. A lasting rally in (select?) momentum stocks could be all the catalyst the market needs (I am not sure who is the egg and who is the chicken though…!)
For those expecting a stock market crash anytime soon, recent research posted at the Federal Reserve may disappoint you. In “Forecasting Stock Market Crashes is Hard–Especially Future Ones: Can Option Prices Help?“, author Eric Engstrom suggests that a “crash” is not imminent (assuming options prices on the S&P 500 have not changed much over the past month or so).
Now, let’s take a look at a wide spectrum of related charts. I cannot claim this sample is representative, but these are the kinds of charts that I am checking out regularly. They tell me the overall evidence is mixed with enough signs telling me that the time to aggressively short expensive/momentum stocks is ending and select buying opportunities are starting to appear. Some of these stocks are/were not momentum/expensive high-flyers, but I find them important to include in the mix given how they received heavy headlines earlier in the year and last year (Turkey and Japan in particular).
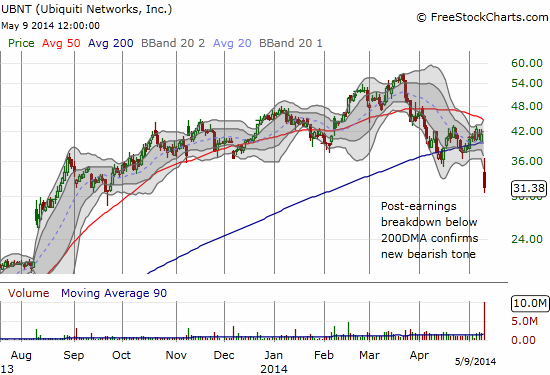
Ubiquiti Networks (UBNT) just confirmed that its misery may yet be in the early stages with a massive post-earnings collapse that broke the stock down from a wedge between a declining 50DMA and a rising 200DMA. The stock could not even manage much of a bounce back toward its lower-BB. Bears will certainly be all over any subsequent rallies…
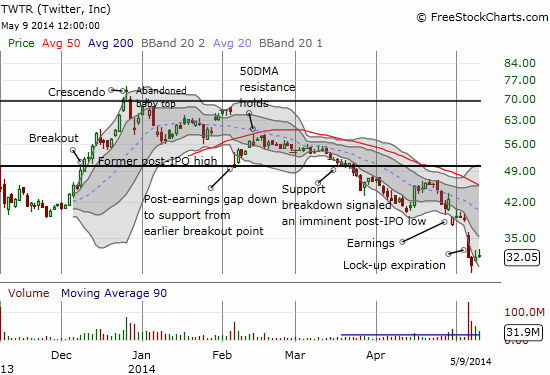
Twitter (TWTR) negativity runs deep. As I noted in the last T2108 Update, I like making a play for TWTR here. The return to the lower-BB took another day, but so far, I am satisfied with my trades and the current progress. I made a second move as I mapped out earlier. TWTR has been aided by surprising upgrades from Morgan Stanley (underweight to equal-weight) and BofA/Merrill (underperform to neutral). A simple end to the selling is all I need on this trade. Such an event could also provide an important signal for the momentum crowd. Note how the expiration of the lock-up forced an acceleration in TWTR’s downtrend that could provide a climactic event.
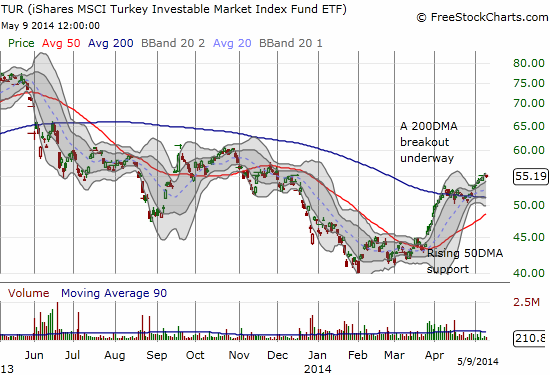
Remember the economic turmoil in Turkey? I didn’t think so. The iShares MSCI Turkey (TUR) has quietly come back and is actually breaking out to a 15% gain on the year. TUR is what a cessation in hostilities looks like. In late January, I laid out the case for a counter-trade on the Turkish lira (USD/TRY) that worked out pretty well…I only wish I had just stubbornly stuck with the trade rather than locking in profits so quickly.
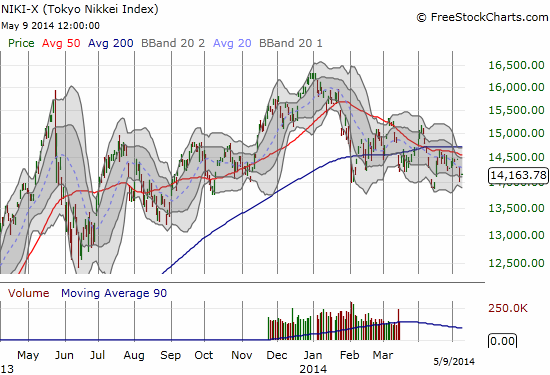
The Japanese stock market as represented by the Nikkei (NKY) is now severely under-performing the S&P 500 with a 13% loss for 2014. The upward momentum ended with the end of 2013 and a marginal beat of the former multi-year high. Yet, the Nikkei has not yet broken down…
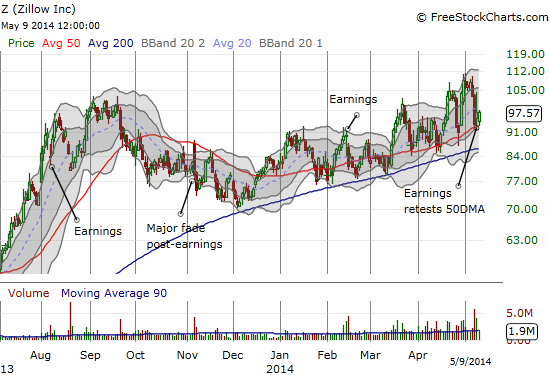
Zillow (Z) has stubbornly maintained its status as a momentum stock. It has even provided consistent trades for both bears and bulls who have astutely followed the months-long upward channel. I have even caught a few. Zillow’s resilience is even more impressive given the way housing-related stocks have stalled. Even Janet Yellen noted concerns about housing in her report on the economic outlook before the Joint Economic Committee, U.S. Congress. On the surface, Zillow would seem to be in all the wrong places at the wrong time.
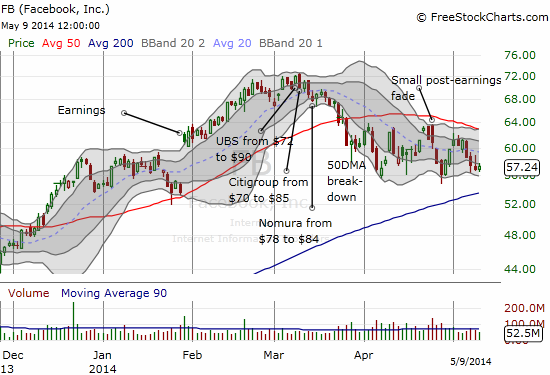
I still think Facebook (FB) has topped out. However, the stock deserves credit for not yet experiencing the complete breakdown that has befallen so many other high-flyers. Since FB will likely become a top pick of returning momentum buyers if a cessation in hostilities occurs, I have returned to buying call options on FB sell-offs. This has worked relatively well given the trading range below the 50DMA….
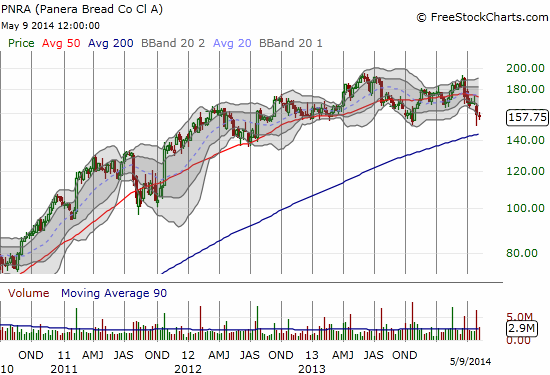
I included Panera (PNRA) because it was once a momentum stock before momentum was widely fashionable during this cycle. PNRA’s status ended with wide churn in 2013. So 2014 becomes a critical year for PNRA as it struggles with an apparent double-top and a 200DMA breakdown (on the daily chart)…
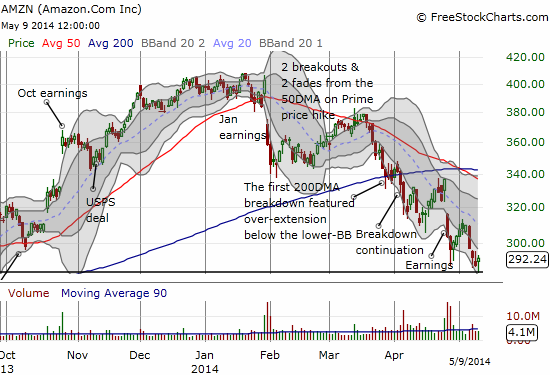
Amazon.com (AMZN) has become a favorite momentum poster child given its stubborn will to push higher almost no matter what the company reports for earnings. The current slide though is the steepest the stock has experienced in a long time. Fans are surely getting a good test here as the stock prints a classic topping pattern.
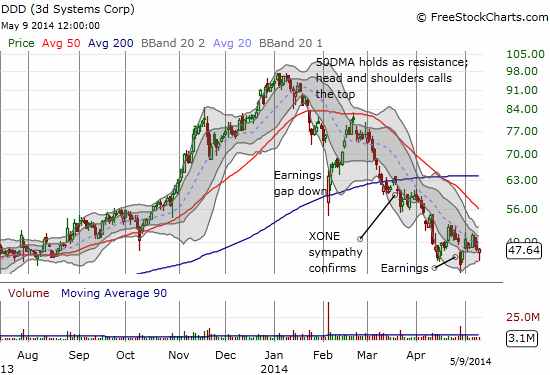
3d Systems (DDD) was a classic faddish darling. The stock looks like it has topped and traders are almost certainly going to continue fading/selling rallies at natural resistance levels.
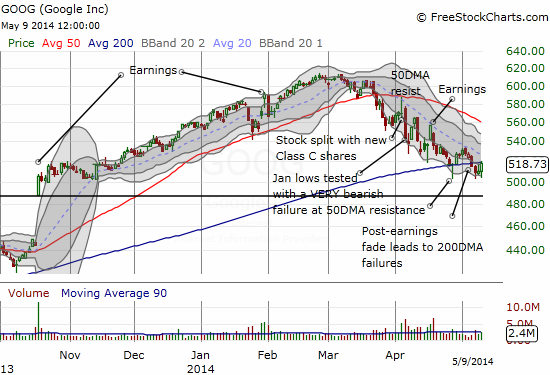
Google (GOOG) has fallen surprisingly fast given it is a familiar company with strong financials. The current struggle at the 200DMA is important to watch…
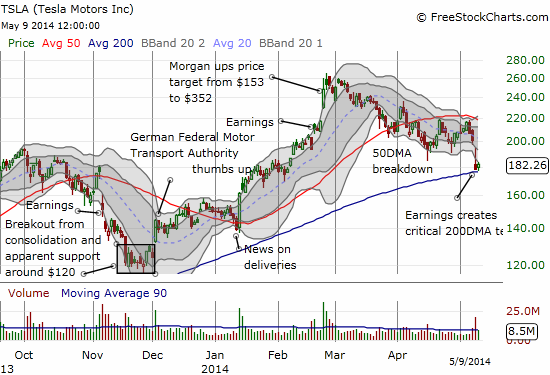
Tesla (TSLA) still qualifies as a momentum stock even as it now struggles with its 200DMA following a poorly received earnings report. It was of course nearly impossible for an expensive stock like TSLA to produce pleasing results in the current phase of market sentiment. However, I decided to make a bet on a potential stand at the 200DMA by selling a single June put for a substantial premium as the stock sold off into the close on Thursday. This is definitely high-octane, high-risk. If I am correct about even a cessation of hostilities against momentum stocks, the put option should lose value relatively quickly. Moreover, a breakdown from the 200DMA is likely to cause the kind of over-extension from the lower-BB that will subsequently produce a rally back to the lower-BB/200DMA, another premium draining event. Stay tuned on this one! (I will definitely not press my luck here).
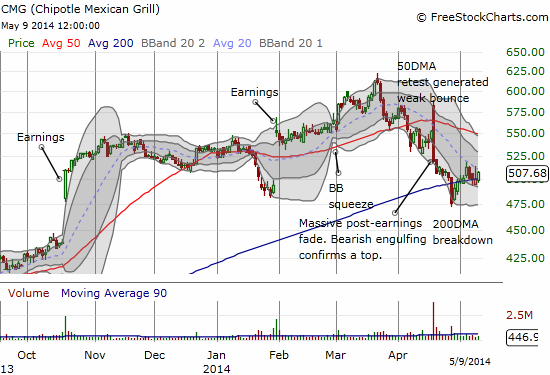
Chipotle Mexican Grill (CMG) is the rare momentum stock that is not in tech (particularly the cloud/internet/social crowd). The post-earnings bearish engulfing pattern fading from a false 50DMA breakout is one of those classic bearish/topping signs. So, the current struggle at the 200DMA is VERY important for the stock. If it loses this battle, it will become a bigger and bigger target for shorts as momentum should continue to fade and fade relatively quickly.
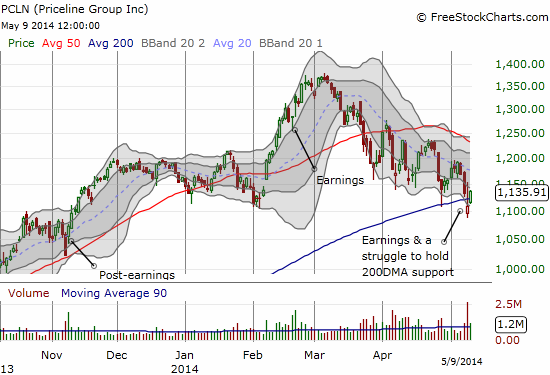
Priceline.com (PCLN) has enjoyed a lot of success – so much so that the stock had not even come close to its upward climbing 200DMA since January, 2013. One more important tell in the making…
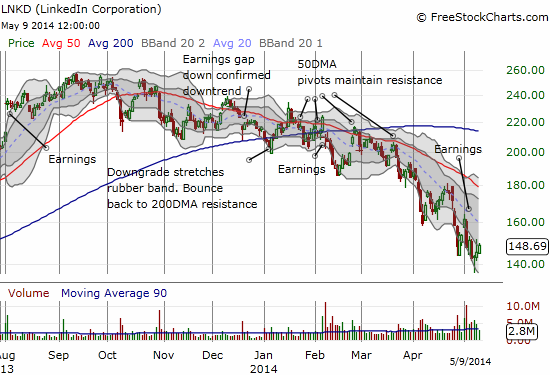
LinkedIn (LNKD) was an early momentum failure with a top last September. The downtrend steepened when the momentum sell-off started gaining notice in late March (I think I was one small step ahead of the mainstream media on that call in my posts “More Topping Signs,” “Chart Review Madness: Bearishness Abounds,” and “A Day Momentum Died“). Note in the chart below how fast LNKD in pulled away from its 50DMA. Now the 20DMA is capping the stock. The hammer that may finally provide some kind of bottom is hard to see, but it IS there at the most recent lows…
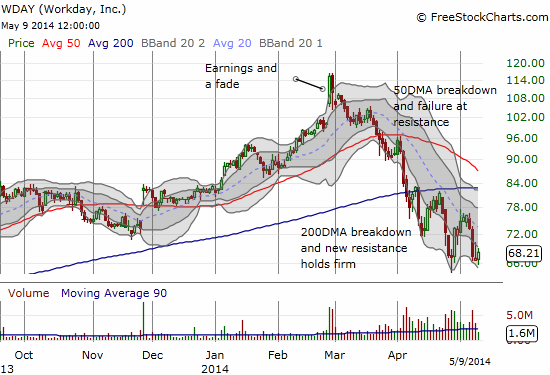
Workday (WDAY) is still a HUGE concern. I think the chart says it all…
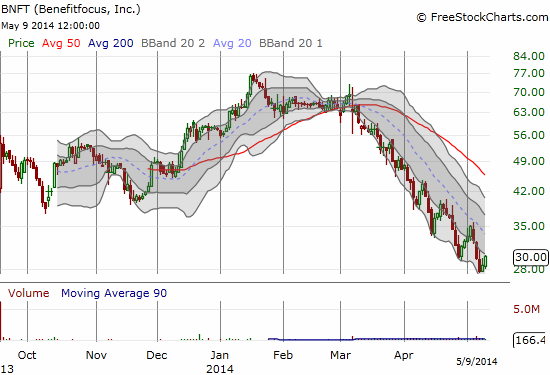
I think Benefitfocus (BNFT) took on momentum status from traders who regretted missing the WDAY bandwagon. The near complete collapse in support for the stock the past two months is quite telling. Fresh all-time lows have yet to take the stock back to its $26 IPO price. The original price range was $21.50 to $24.50. I highly doubt BNFT’s steep downtrend will end as long as WDAY struggles. Even after WDAY stabilizes, investors/traders will likely demand BNFT turn in strong results before getting interested again.
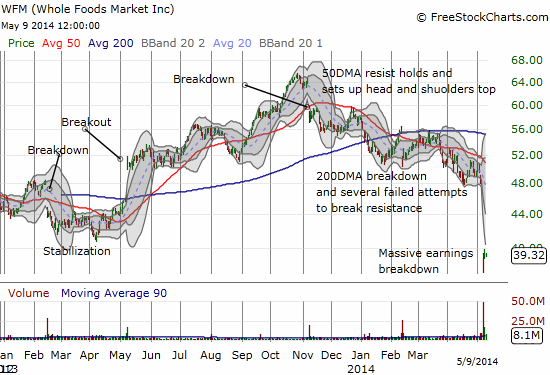
Whole Foods Market (WFM) completely collapsed after its latest earnings. This is one of those sell-offs that looks obvious in hindsight. WFM is/was a non-tech momentum stock that enjoys a lot of brand familiarity. But given the high valuation, the company needed to produce a blemish-free report in the current environment. WFM failed the test miserably. Given the topping pattern, I strongly suspect sellers/shorts will be all over the stock on attempted rallies.
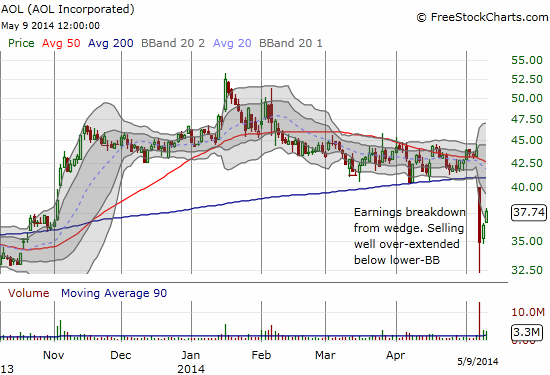
AOL was dead in the water after returning to the public markets as an independent entity in 2009. A steep plunge in the summer of 2011 printed a dramatic bottom that led to an impressive run-up for 15 months or so. Since then, AOL has enjoyed spurts of interest followed by months and months of churn. The latest earnings report may have inverted the pattern. I now think the stock will suffer spurts of selling followed by weak reprieves.
There are of course many, many other charts to show and stories to tell. Hopefully these have provided a flavor for some of the more compelling tales of woe and hope. One final note on my trading bias. I will continue to fade rallies, mainly on QQQ, until it manages to break form 50DMA resistance. I have also continued to lock in profits quickly on QQQ puts and now QID calls.
Daily T2108 vs the S&P 500
")
Black line: T2108 (measured on the right); Green line: S&P 500 (for comparative purposes)
Red line: T2108 Overbought (70%); Blue line: T2108 Oversold (20%)
Weekly T2108

*All charts created using freestockcharts.com unless otherwise stated
Related links:
The T2108 Resource Page
Expanded daily chart of T2108 versus the S&P 500
Expanded weekly chart of T2108
Be careful out there!
Full disclosure: long SSO puts, long FUEL, short TWTR puts, short covered call on TWTR, long LNKD, short FB, long FB calls,
I really appreciate your commentary and your sharing of your expertise and market insights. I have learned a lot from your posts, and look for new posts every day.