
(T2108 measures the percentage of stocks trading above their respective 40-day moving averages [DMAs]. It helps to identify extremes in market sentiment that are likely to reverse. To learn more about it, see my T2108 Resource Page. You can follow real-time T2108 commentary on twitter using the #T2108 hashtag. T2108-related trades and other trades are posted on twitter using the #120trade hashtag)
T2108 Status: 44.4%
VIX Status: 17.4
General (Short-term) Trading Call: Short (bearish bias) with caveats (see below)
Active T2108 periods: Day #143 over 20%, Day #28 over 40% (overperiod) (ending 1 day over 50%), Day #4 under 60% (underperiod), Day #4 under 70%
Reference Charts (click for view of last 6 months from Stockcharts.com):
S&P 500 or SPY
SDS (ProShares UltraShort S&P500)
U.S. Dollar Index (volatility index)
EEM (iShares MSCI Emerging Markets)
VIX (volatility index)
VXX (iPath S&P 500 VIX Short-Term Futures ETN)
EWG (iShares MSCI Germany Index Fund)
CAT (Caterpillar).
Commentary
The bounce from quasi-oversold conditions lasted just a day. T2108 tumbled under 50% again to close at 44.4%. The S&P 500 fell 1.0%; the index is just barely clinging to support formed by the post-taper low shown below. It should have occurred to me earlier that this line would become a major battleground before the 200DMA.
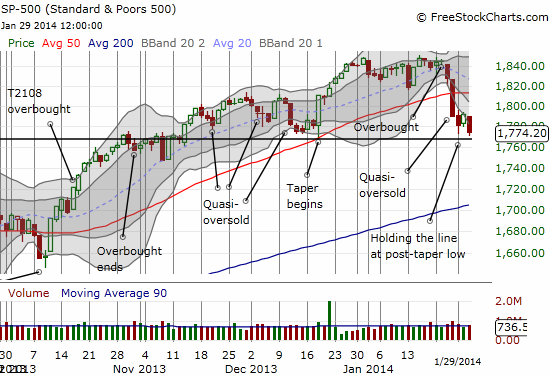
What a difference a month makes: the narrative has gone from…”Yay! The Fed is tapering indicating its confidence in U.S. growth”, to… “Oh no! The Fed is tapering and threatening to explode emerging markets! The contagion will destroy the global economy!” The happy post-tapering gains are gone now, but all it will take is a simple re-adjustment in the narrative to get spirits moving up and to the right again.
As promised, I faded a resurgence in volatility. Once before the Fed and again after the Fed announced it is full steam ahead on tapering. I reloaded on iPath S&P 500 VIX ST Futures ETN (VXX) put options but was not able to get put options on ProShares Ultra VIX Short-Term Fut ETF (UVXY) at my bid. If volatility takes yet another spike upward, UVXY put options are my next target. As a reminder, I am betting on an expectation for a post-Fed collapse in volatility. This is independent of the bear/bull trading bias on the S&P 500.
The trading bias remains bearish simply because the S&P 500 cracked 50DMA support. The downside target is the 200DMA. In between, I am willing to bet on bounces. Today, it was a quasi-oversold bounce. Tomorrow, a bounce should come from support and an over-extension of the index below its lower-Bollinger Band (BB). If T2108 hits official oversold (20% or below), the bias switches to bullish, and I will likely get aggressive. Note that I did NOT add to my small SSO calls on today’s extension of the sell-off. I will fade rallies from here that approach the 50DMA (now) resistance.
Finally, the whole issue with the collapse in the Turkish currency, the lira, takes me back to last year when nearby Cyprus was causing a panic. In March, I even wrote about the fears of financial contagion in “Cyprus: Low Volatility And Risky Plans.” I concluded with the following:
“Through it all, traders must keep in mind BOTH the bearish and bullish opportunities that renewed volatility present. After all, the Cyrpus crisis could well go the way of all the other past eurozone crisis… another big dip and buying opportunity that gets smaller and smaller in the rearview mirror. In other words, do not chase panics downward and keep position sizes small.”
This is what I now feel about Turkey. No one even bothers mentioning Cyprus less than a year later after the EU bailed out the country. Something tells me it will be the same for Turkey although it will be Turkey’s own central bank doing the bailing (or at least trying to do so). At some point, the currency will stabilize and folks will look back in retrospect and wonder how they missed the buying opportunity. So, baby steps, I decided to start nibbling on USD/TRY. I am kicking myself that I did not think trading this currency pair earlier. A simple stop limit ahead of the central bank position would have delivered a nice short position that would have been very profitable within a minute. Interestingly, the market has already faded the central bank’s move. Yet the reversal created its own intraday climactic top.
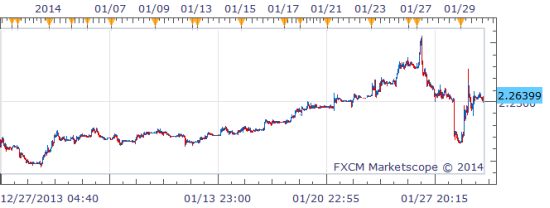
Source: FXCM.com
The first chart is an intraday chart showing the recent drama in the currency. Traders clearly panicked in a massively climactic top just ahead of the central bank’s unexpectedly large rate move. I am guessing the rapid move forced the bank’s hand to do something equally dramatic:
“The bank raised its overnight lending rate to 12 percent from 7.75 percent, its one-week repo rate to 10 percent from 4.5 percent, and its overnight borrowing rate to 8 percent from 3.5 percent – all much sharper moves than economists had forecast.”
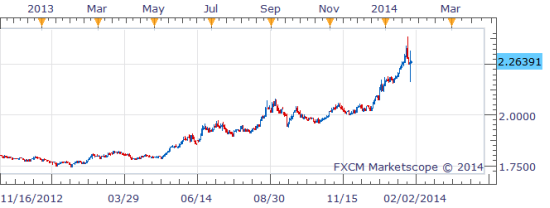
The second chart is a daily chart to show how long trouble has been bubbling. Notice how the chart went parabolic toward the end – a classic sign of a top.
At current rates, I can afford to wait out a small position. The ride promises to continue to be VERY turbulent, so a small position is also a must.
Daily T2108 vs the S&P 500
")
Black line: T2108 (measured on the right); Green line: S&P 500 (for comparative purposes)
Red line: T2108 Overbought (70%); Blue line: T2108 Oversold (20%)
Weekly T2108

*All charts created using freestockcharts.com unless otherwise stated
Related links:
The T2108 Resource Page
Expanded daily chart of T2108 versus the S&P 500
Expanded weekly chart of T2108
Be careful out there!
Full disclosure: long SPHB and SPLV and SSO puts; long VXX shares and puts; short USD/TRY