
(T2108 measures the percentage of stocks trading above their respective 40-day moving averages [DMAs]. It helps to identify extremes in market sentiment that are likely to reverse. To learn more about it, see my T2108 Resource Page. You can follow real-time T2108 commentary on twitter using the #T2108 hashtag. T2108-related trades and other trades are posted on twitter using the #120trade hashtag)
T2108 Status: 54.9%
VIX Status: 13.4
General (Short-term) Trading Call: Short (fade rallies).
Active T2108 periods: Day #209 over 20%, Day #61 over 40% (over-period), Day #13 over 50% (over-period), Day #17 under 60% (under-period), Day #21 under 70%
Reference Charts (click for view of last 6 months from Stockcharts.com):
S&P 500 or SPY
SDS (ProShares UltraShort S&P500)
U.S. Dollar Index (volatility index)
EEM (iShares MSCI Emerging Markets)
VIX (volatility index)
VXX (iPath S&P 500 VIX Short-Term Futures ETN)
EWG (iShares MSCI Germany Index Fund)
CAT (Caterpillar).
Commentary
The S&P 500’s inching against gravity experienced a notable setback in trading on Tuesday with the index falling 0.9% to its 50-day moving average (DMA).
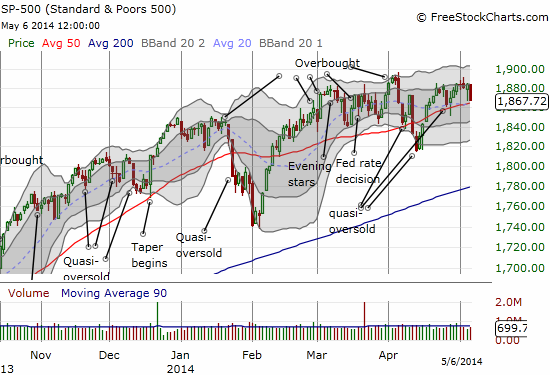
Note the growing tension between the upward drift along the 50DMA and tight resistance in the 1880 to 1900 range. A breakout or breakdown out of this tension should be a major event.
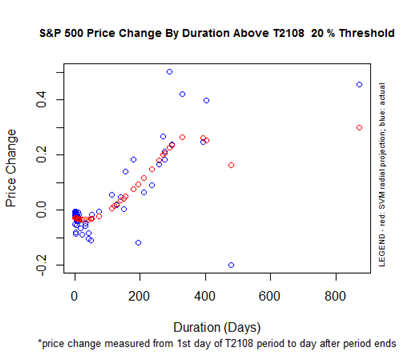
T2108 is meandering along and not telling us much right now. My favorite technical indicator closed the day at 55.0%. It is notable that T2108 is now 209 trading days away from its last oversold reading. In calendar days that is almost 11 months ago. The S&P 500 is up 17.6% since that time. The chart below shows that this performance is exactly where we should expect the index to be IF the 20% overperiod ended today. This relationship suggests that a drop to oversold levels may not involve a deep sell-off. Indeed, the S&P 500 is just 5% higher from where it was when T2108 hit 30% back in December, 2013. A shallow sell-off would be consistent with an index that is carefully hugging its 50DMA.
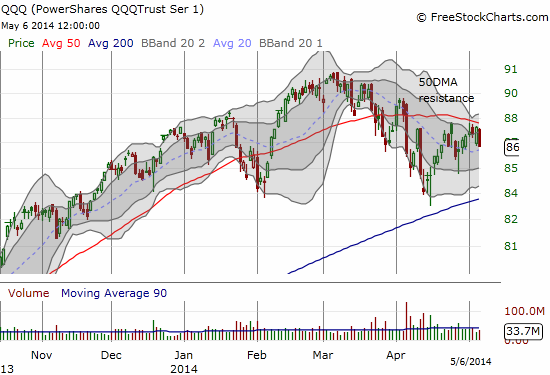
The NASDAQ continues its under-performance. The tight overhead resistance shows up most strongly in the QQQ. Note how neatly the 50DMA has capped progress over the last month.
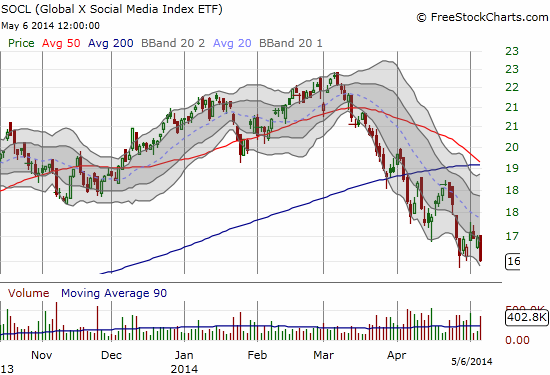
The NASDAQ’s troubles are looking milder and milder compared to the troubles in many expensive, former high-flying technology-related stocks. For example, the Global X Social Media Index ETF (SOCL) is now down 26% from its recent peak.
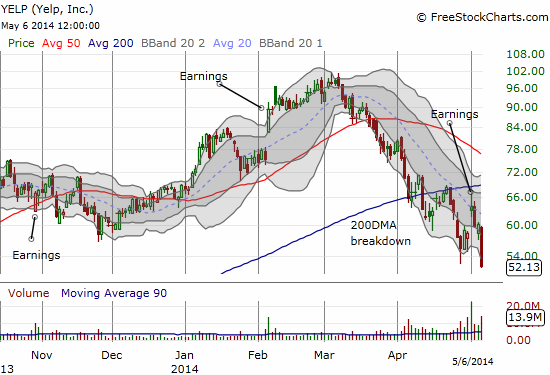
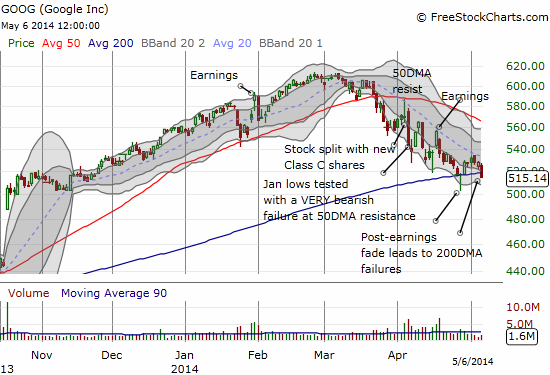
There are now a LOT of charts I want to review but time only allows me to show one, but I will give you two as a bonus: Yelp (YELP) and Google (GOOG).
YELP experienced a nice post-earnings pop last week that came just short of its 200DMA resistance. It pulled sharply back the next day and by post-earnings day #2 it had reversed all its gains. Now, on post-earnings day #3, it closed at an 8-month low. This move now reverses much of the gains of an August, 2013 breakout. YELP joins many stocks of the momentum ilk that had temporary post-earnings reprieves.
I point out GOOG because its Class C shares closed below the all-important 200DMA support. GOOG survived a 200DMA retest last week with a sharp intraday reversal from an initial breakdown. Not this time. Follow-through selling here could drag sentiment in the space even lower. Note how well the declining 20DMA is providing overhead resistance.
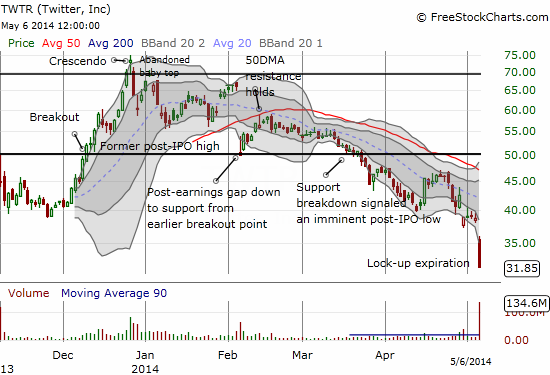
OK. I can’t ignore Twitter (TWTR), so one more chart. TWTR cracked a fresh all-time low as an IPO lockup expired in dramatic fashion. This is the kind of selling we used to expect for expensive post-IPO stocks when insiders finally get a chance to lock in profits. Trading volume set a record for the stock at 134.6M shares. On the first day of trading on November 7, 2013, 117.6M shares traded hands.
Suffice to say that TWTR has become the whipping boy and poster child for the implosion of expensive tech stocks, especially internet-related ones, double especially for social media. The stark negativity in TWTR is amazing, particularly because the stock had reached such crazy heights just under two months into its existence. According to Schaeffer’s Investment Research, only 4 of 24 analysts are positive on TWTR (all strong buys). Twelve are at hold, one is a sell, and a whopping 7 are strong sell. The open interest put/call ratio is off its peak but remains high. Short interest continues to increase to new records, now at 14% of float.
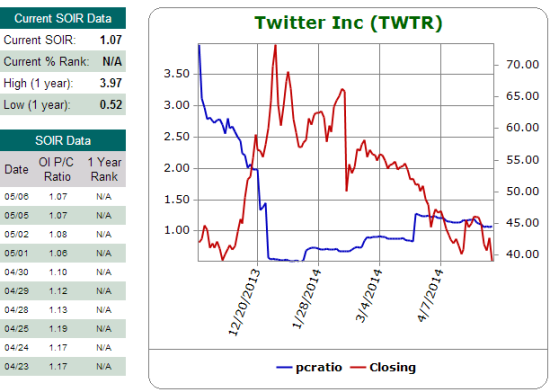
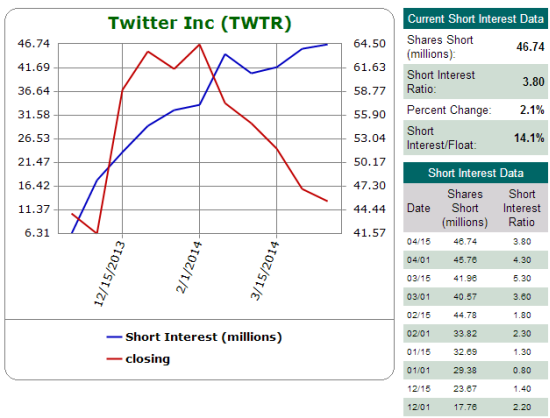
Source: Schaeffer’s Investment Research
With TWTR plunging well below its lower-Bollinger Band (BB), the contrarian in me could not help itself. I executed a low risk trade by selling a put spread. If TWTR continues to plunge, I plan to sell the long side and ride out the short side. I will take delivery of stock, hopefully at a great discount as the case may be. Stay tuned on this one. (If the stock plunges even further away from the lower-BB I will almost certainly buy stock for a potential quick flip as such an extension in selling is typically unsustainable in the very short-run).
May 7, 2014 addendum. Sentiment is decidedly bearish on StockTwits for Twitter as well. It is very interesting to see the brief burst in hope that preceded earnings. A hope bubble that quickly popped?
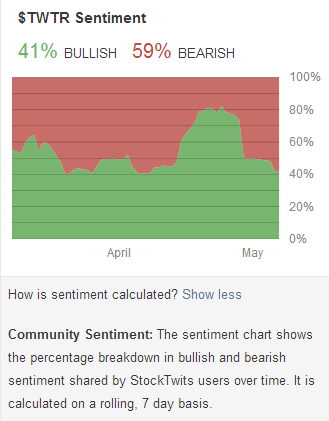
Source: StockTwits
Daily T2108 vs the S&P 500
")
Black line: T2108 (measured on the right); Green line: S&P 500 (for comparative purposes)
Red line: T2108 Overbought (70%); Blue line: T2108 Oversold (20%)
Weekly T2108

*All charts created using freestockcharts.com unless otherwise stated
Related links:
The T2108 Resource Page
Expanded daily chart of T2108 versus the S&P 500
Expanded weekly chart of T2108
Be careful out there!
Full disclosure: long SSO puts, long QID calls, long QQQ puts, short TWTR put spread and long TWTR calls