
(T2108 measures the percentage of stocks trading above their respective 40-day moving averages [DMAs]. It helps to identify extremes in market sentiment that are likely to reverse. To learn more about it, see my T2108 Resource Page. You can follow real-time T2108 commentary on twitter using the #T2108 hashtag. T2108-related trades and other trades are posted on twitter using the #120trade hashtag)
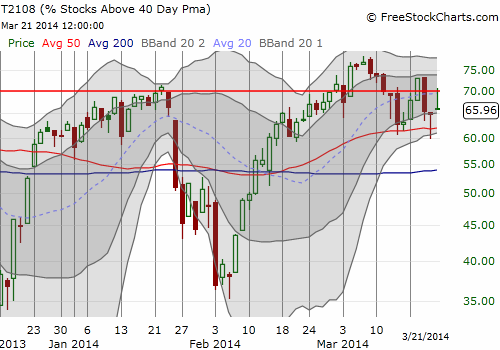
T2108 Status: 66.0%
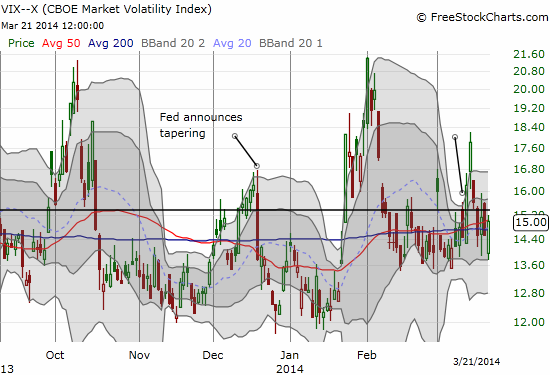
VIX Status: 15.0
General (Short-term) Trading Call: Short (fade rallies)
Active T2108 periods: Day #179 over 20%, Day #25 over 60% (overperiod), Day #3 under 70% (underperiod)
Reference Charts (click for view of last 6 months from Stockcharts.com):
S&P 500 or SPY
SDS (ProShares UltraShort S&P500)
U.S. Dollar Index (volatility index)
EEM (iShares MSCI Emerging Markets)
VIX (volatility index)
VXX (iPath S&P 500 VIX Short-Term Futures ETN)
EWG (iShares MSCI Germany Index Fund)
CAT (Caterpillar).
Commentary
It was late Thursday night (March 20). I debated typing out a quick T2108 Update. I chose sleep instead. I am glad I did. What happened in Friday’s trading action is even more significant than what happened on Thursday.
First, rolling back the tape, the S&P 500 (SPY) essentially made a complete recovery from Wednesday’s post-Fed selling – the classic fade the Fed and then fade the fade move. As I mentioned earlier in the week, I expected this to and fro. However, T2108 surprised me: my favorite technical indicator actually took a deep plunge to start the day and just barely managed to close near flat on the day. The move looked almost looked like a bearish divergence. At least it seemed to generate non-confirmation for Thursday’s rally.
Second, on Friday, the S&P 500 punched out a new all-time (intraday) high. T2108 even crossed the overbought threshold (70%) yet again. According to my rule, I faded the move with a barrage of fresh put options on ProShares Ultra S&P 500 (SSO). In the back of my mind I pondered the possibility of an extended over-bought rally launching. I did not have long to wring my hands. Eventually, the S&P 500 began to weaken. It managed to fade 17 points to close with a fractional loss (-0.29%) that is small in size but looms large in significance. A fade that occurs from a presumed top looks like a confirmation of that top. Volume surged on the day, raising another yellowish red flag. No doubt options expiration had a lot to do with the upward thrust, but it is a signature mark for a climactic type of top. The charts below show a close-up of the daily action on the S&P 500 and T2108.
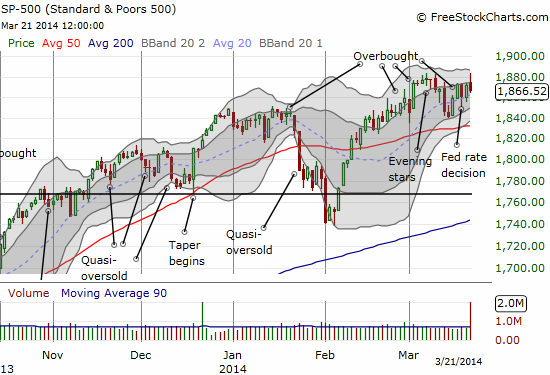
I used the weak close to unload all my fresh SSO puts and lock in profits. I will be looking next week for confirmation of this new weakness in the market. As usual, I am bracing for quick churn up and down, and looking to fade rallies on the S&P 500.
The volatility index of course made a strong comeback from its lows on the day. It remains under the 15.35 pivot point, it has plenty of room to zoom higher on an increasing market risk profile.
I have also noted a LOT of toppy looking charts in stocks that have served as momentum favorites for months. I will post those in a separate cornucopia of chart reviews. Suffice to say that I took the opportunity to chase some of these stocks lower. These new positions gave me additional motivation to lock in the profits on the SSO puts.
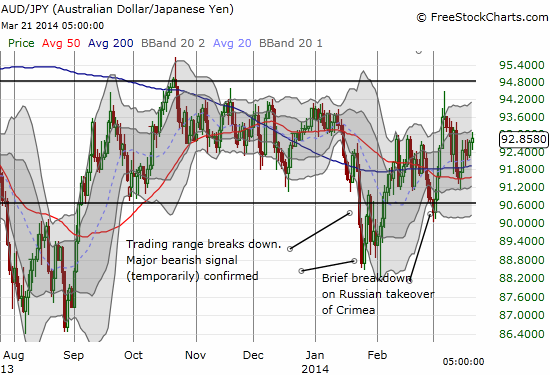
In foreign exchange (forex), I am looking most closely at the Australian dollar versus the Japanese yen (AUD/JPY) for advanced sign of trouble or at least confirmation. AUD/JPY is still failing to oblige. The currency pair managed to close marginally higher and rests comfortably smack in the middle of its extended trading range.
Finally, I want to note that I think the market over-reacted to Yellen’s press conference on Wednesday. So, I am definitely not including a read on the Fed for my trading call. To the extent the market is reacting to the Fed, then I am reacting. Otherwise, I am keeping a keen eye on the tea leaves…and they look ready for a tumble to oversold conditions…Stay tuned for the big chart review.
Daily T2108 vs the S&P 500
")
Black line: T2108 (measured on the right); Green line: S&P 500 (for comparative purposes)
Red line: T2108 Overbought (70%); Blue line: T2108 Oversold (20%)
Weekly T2108

*All charts created using freestockcharts.com unless otherwise stated
Related links:
The T2108 Resource Page
Expanded daily chart of T2108 versus the S&P 500
Expanded weekly chart of T2108
Be careful out there!
Full disclosure: long SSO puts, long UVXY shares; net long the U.S. dollar