
(T2108 measures the percentage of stocks trading above their respective 40-day moving averages [DMAs]. It helps to identify extremes in market sentiment that are likely to reverse. To learn more about it, see my T2108 Resource Page. You can follow real-time T2108 commentary on twitter using the #T2108 hashtag. T2108-related trades and other trades are posted on twitter using the #120trade hashtag)
T2108 Status: 63.2%
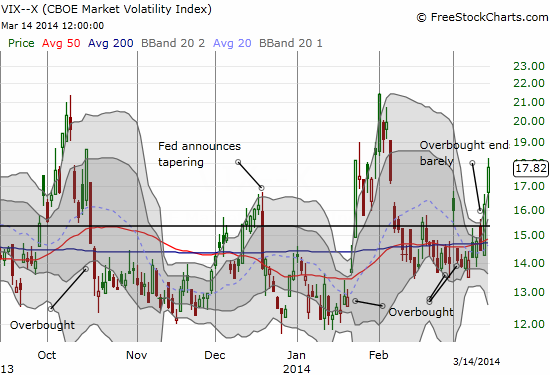
VIX Status: 17.8 (a jump of 9.9%)
General (Short-term) Trading Call: Short (fade rallies)
Active T2108 periods: Day #174 over 20%, Day #20 over 60%, Day #3 under 70% (underperiod)
Reference Charts (click for view of last 6 months from Stockcharts.com):
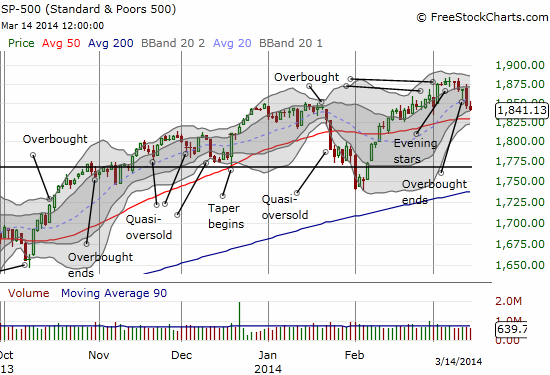
S&P 500 or SPY
SDS (ProShares UltraShort S&P500)
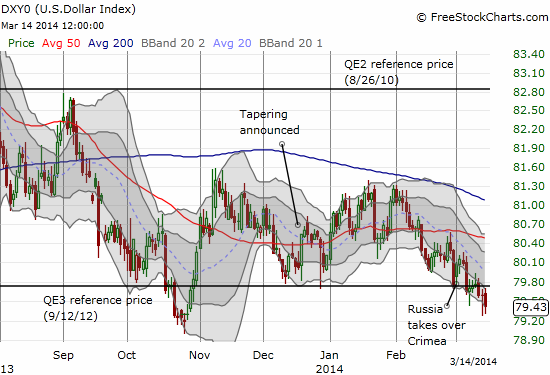
U.S. Dollar Index (volatility index)
EEM (iShares MSCI Emerging Markets)
VIX (volatility index)
VXX (iPath S&P 500 VIX Short-Term Futures ETN)
EWG (iShares MSCI Germany Index Fund)
CAT (Caterpillar).
Commentary
As I stated this week, the market just needed an excuse to begin a sell-off. Interestingly, the latest angst seems to feed off old headlines as the narrative went from a market moving past weak Chinese data and relieved by Ukraine crisis containment to a market that cares tremendously. My call for a top has nothing to do with these specific events: they are just convenient catalysts. Instead, I just see signs that buyers are finally exhausted – like having their fill at the dinner table and dessert. This is NOT a call for a massive sell-off, bear market, collapse, etc. This is a call to say that for the time-being, rallies are fadeable. Going forward, the market is not a buy until T2108 flips oversold, or the S&P 500 manages to print a fresh all-time high. I think the former is likely to happen before the latter given what I consider is stiff technical resistance formed by the “evening star” pattern in the chart (see below).
As a reminder, my trading call flipped to bearish as soon as T2108 dropped out of overbought conditions. It was a marginal change then. It became a solid bearish call on Thursday’s close below Wednesday’s low. Accordingly, I started a fresh tranche of ProShares Ultra S&P 500 (SSO) puts on the morning’s brief rise (I also sold an old one expiring next Friday right at the open to help fund this tranche). I also finally sold my ProShares Ultra VIX Short-Term Fut ETF (UVXY) shares on Thursday’s sell-off. I waited until near the close to decide to sell it. Since it was a hedge on the previous bullish trading call, I was more interested in taking some profits than trying to hold out for an multi-day sell-off. Given the overall risks I took – including holding for almost two trading weeks week and doubling down – the net 6% or so gain was not worth the ride.
Today, UVXY popped another 5.5% after being up as much as 9.1%. The volatility index, the VIX, surged 9.9% and easily topped the high from the trading that started March. These moves are starks reminder that sentiment is rapidly growing more bearish, something not immediately obvious looking at the fractional loss on the S&P 500 (SPY). T2108 held flat on the day as a potential dealbreaker (bullish divergence), but I will not be surprised to see the S&P 500 gap right down to its 50-day moving average (DMA) on Monday morning. I will give serious consideration to selling my fresh tranche of SSO puts on such a move. Regardless of the path, the 50DMA is a good first testing ground of the market’s latest hiccup.
The U.S. dollar index continued to slide, closing at a fresh 5-month low. As a reminder, I am looking for a rally in the U.S. dollar index to serve as a non-confirming signal of a stock market sell-off. This signal has been compromised to some extent by the apparent bias for the European Central Bank to target a lower euro. Regardless, it is important to note that the U.S. dollar is definitely NOT serving as any kind of safety currency.
I have also noted earlier that it is hard for me to be bearish on the market when the home builders (ITB) are breaking out. Well, I think the breakout is now all but dead. At best, I think the home builders return to rangebound trading. I do not think the market can rally while leaving home builders further behind.
I conclude with a series of interesting chart reviews. All of these stocks I have discussed in the recent past.
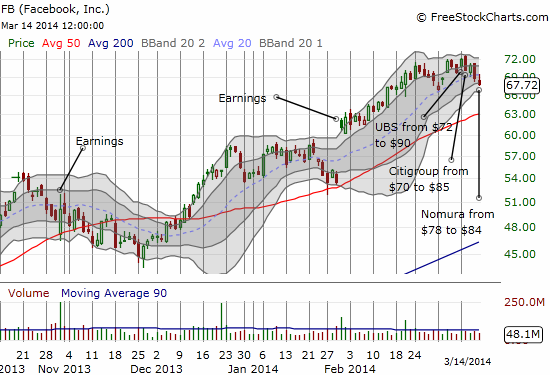
Facebook (FB) is topping. This week, FB got a series a big upgrades that include fresh and higher price targets. The first, by UBS, motivated the stock to register a new (marginal) all-time high. Subsequent upgrades did not dissuade sellers. This lack of response is one likely sign of buyer exhaustion. FB is very likely to hit its 50DMA during this downswing. I continue to build a short position in FB along with hedging on the way up with call options.
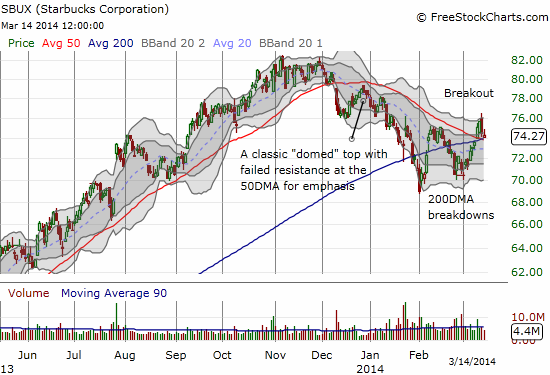
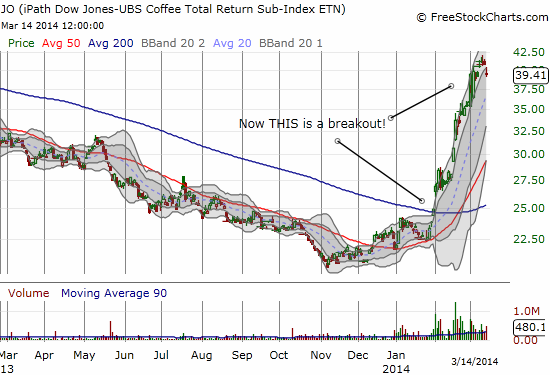
Starbucks (SBUX) managed to break out (much to my chagrin) this week above the converged 50 and 200DMA resistance….without much hesitation even. The sharp market downturn on Thursday brought SBUX back to support (formerly resistance). Bulls can use this as an entry point. I am betting that SBUX will slice back down below support if the general market continues to weaken. Coffee prices (JO) have taken a tremendous leap lately, and I have to believe this will soon enough hit SBUX margins. The big caveat on the technical side is that SBUX has now managed to print higher highs and lower lows.
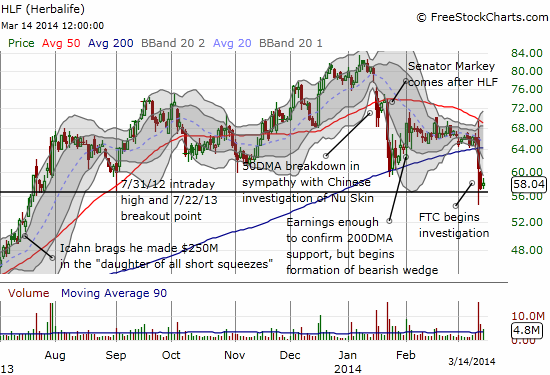
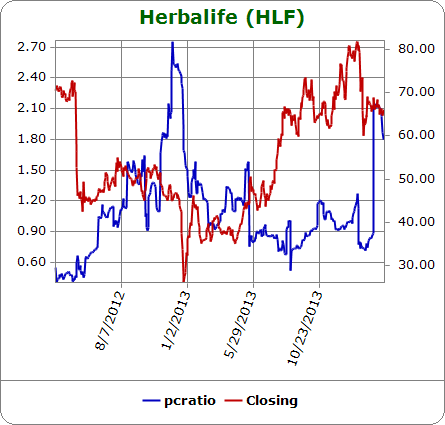
The Federal Trade Commission (FTC) is finally busting the chops of Herbalife (HLF). The sell-off created a classic short trigger with a breakdown from a bearish wedge. I liked HLF when it had catalysts for going long, but I doubt I will try to chase it downward now that headwinds are starting to blow. As long as Icahn is still backing the company, HLF could soar at any moment on news that counteracts the FTC investigation.
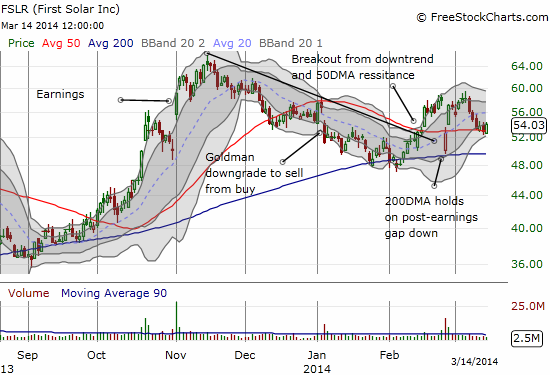
First Solar (FSLR) is clinging to 50DMA support in what could be a bullish setup with a happier market mood. It quickly recovered from a post-earnings gap down that even featured the 200DMA as support. The next big moment will be when FSLR either continues its post-earnings recovery OR breaks 200DMA support.
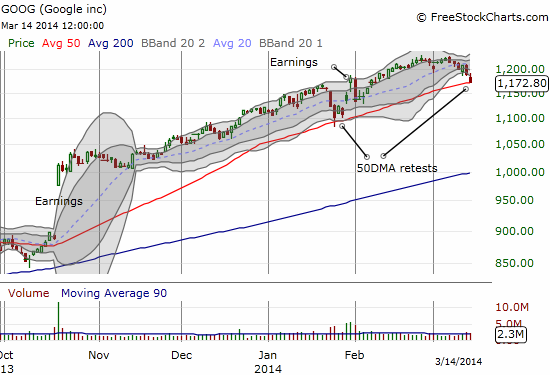
Google (GOOG) has one of the prettiest uptrends in the market. Ever since a major gap up for October earnings, GOOG has had a relatively smooth ride upward. There was one hiccup ahead of January earnigns that gave the 50DMA a test as support. GOOG closed Friday almost exactly on top of this support and is in clear danger of of slipping right through this support. The only “positive” is that the stock is over-extended below its lower-Bollinger Band (BB). That will not matter if the market gaps down on Monday, but clearly GOOG would make for an interesting play for a quick bounce on a further extension below the lower-BB.
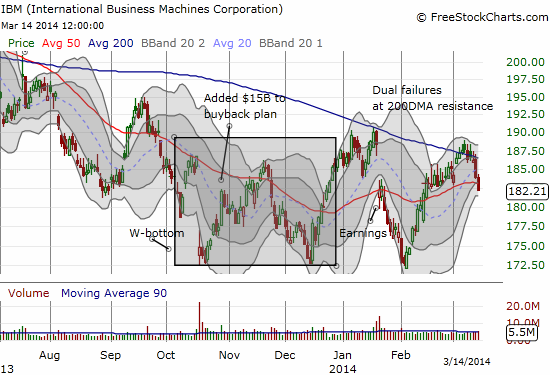
The 200DMA continues to put up stiff resistance for International Business Machines (IBM). This stock continues to perform well as a range-bound trade.
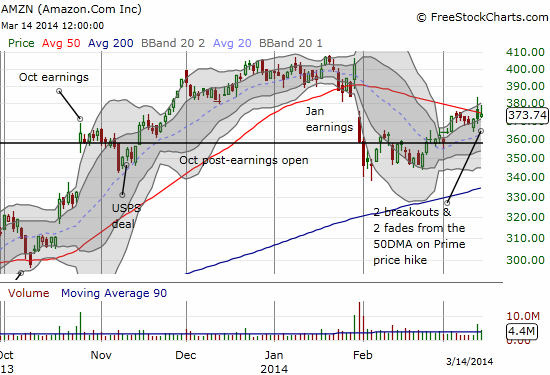
Finally, Amazon.com (AMZN) still gets the award for the world’s most stubborn stock. The post-earnings selling lasted all of two days. A period of consolidation has now led to a 2-day attack on 50DMA resistance. If the market rallies, look for AMZN to finally slice through this resistance. Normally, I would say that continued selling in the general market would support shorting AMZN on the presumption of a 50DMA failed retest. BUT, this is one stubborn stock…
Daily T2108 vs the S&P 500
")
Black line: T2108 (measured on the right); Green line: S&P 500 (for comparative purposes)
Red line: T2108 Overbought (70%); Blue line: T2108 Oversold (20%)
Weekly T2108

*All charts created using freestockcharts.com unless otherwise stated
Related links:
The T2108 Resource Page
Expanded daily chart of T2108 versus the S&P 500
Expanded weekly chart of T2108
Be careful out there!
Full disclosure: long SSO puts and calls, long UVXY shares, net long U.S. dollar; short FB and long calls; short GOOG and long calls; short SBUX; long JO;