
(T2108 measures the percentage of stocks trading above their respective 40-day moving averages [DMAs]. It helps to identify extremes in market sentiment that are likely to reverse. To learn more about it, see my T2108 Resource Page. You can follow real-time T2108 commentary on twitter using the #T2108 hashtag. T2108-related trades and other trades are posted on twitter using the #120trade hashtag)
T2108 Status: 63.3%
VIX Status: 12.2 (near bottom extended range)
General (Short-term) Trading Call: Short (fade rallies, especially in tech).
Active T2108 periods: Day #213 over 20%, Day #65 over 40%, Day #1 over 60% (over-period), Day #25 under 70% (under-period)
Reference Charts (click for view of last 6 months from Stockcharts.com):
S&P 500 or SPY
SDS (ProShares UltraShort S&P500)
U.S. Dollar Index (volatility index)
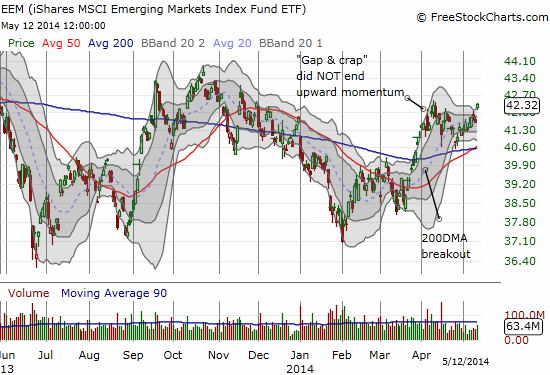
EEM (iShares MSCI Emerging Markets)
VIX (volatility index)
VXX (iPath S&P 500 VIX Short-Term Futures ETN)
EWG (iShares MSCI Germany Index Fund)
CAT (Caterpillar).
Commentary
Right after I wondered aloud about a “cessation of hostilities” against momentum/high-flying/and other related expensive “growth” stocks, the S&P 500 (SPY) closed at a fresh all-time high. The close today exactly matched the intraday high from April 4, 2014. Even better that it is just below the psychologically important round number of 1900.
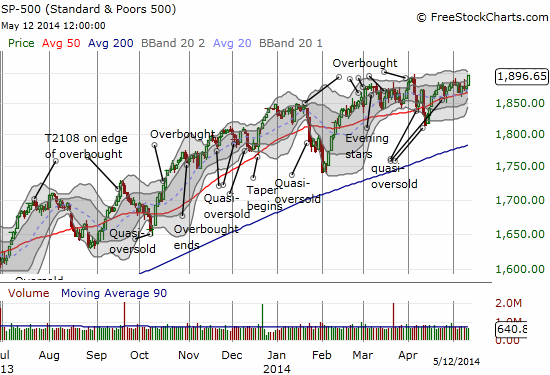
Many of the stocks I highlighted in the last T2108 Update surged along with the general stock market. In particular, 200-day moving average (DMA) support lines held firm and true. In parallel, T2108 surged to 63.3%. Suddenly, I have to consider the possibility of an overbought market again. I am not, however, contemplating an extended overbought run, not yet anyway. Instead, I am watching volatility.
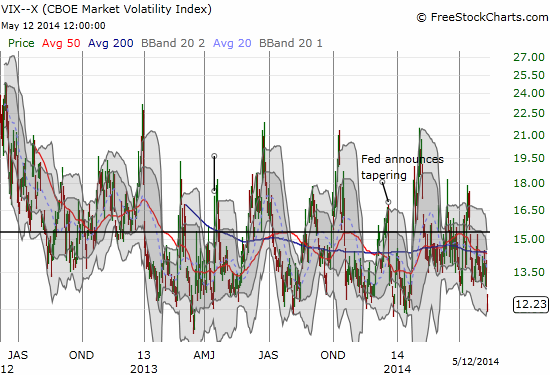
Volatility in the form of the VIX dropped 5.3% to the bottom of a trading range in place since around the beginning of 2013. Note in the chart below how the VIX has not spent much time at these levels over this extended range. It is certainly possible that the VIX can go even lower.
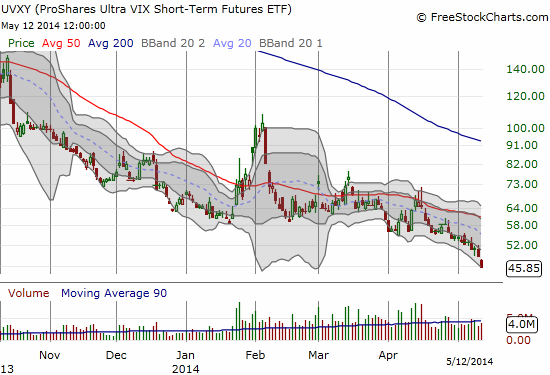
I promptly sold my puts on ProShares Ultra VIX Short-Term Fut ETF (UVXY). A Friday expiration gave me extra motivation to do so. I did not turn around and buy shares in accordance to my (now) stricter rule to only fade this ever falling ETF.
I stuck to the trading bias to fade the PowerShares QQQ (QQQ) – this time with call options on ProShares UltraShort QQQ (QID). I am also planning to scale back my plans to play bounces among the fallen high-flying crowd. I even initiated a small short along with put options on Workday (WDAY) which I pointed out in the last post is one of the former momentum stocks that still has me worried. Its 20DMA held true again today and capped the sharp intraday bounce. My short put on Tesla (TSLA) is one of the positions I will scale back, especially since it is the highest risk here. News Monday night that Toyota (TM) will end its battery-supply deal with Tesla may complicate my exit even though this news seems to make official what was already expected.
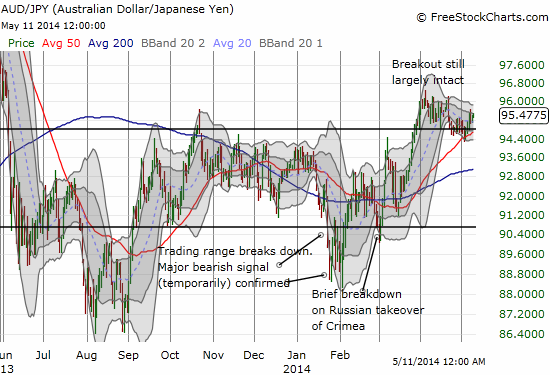
I hope in another week or so to do another refresh on the “Sell in May” legend to add in relative VIX levels and stock market valuations to see whether they provide any additional insight into the chances of actual selling in May (and/or this summer). I am also wrestling mightily with Robert Shiller’s notion that the stock market is in a bubble, Fed Chair Janet Yellen’s quasi-counter observation that stocks are not in “obviously bubble territory,” a potential fresh breakout on the S&P 500 that could suggest a new run-up underway, and the implicit/explicit hazards of a rock-bottom VIX combined with an imminently overbought T2108. Moreover, the Australian dollar continues churn merrily along with the currency still in breakout territory against the Japanese yen (AUD/JPY). Emerging market stocks as represented by iShares MSCI Emerging Markets (EEM) is also in breakout territory that is well-supported by its 200DMA and its now upward sloping 50DMA.
Time will certainly tell.
Excuse me in advance for giving both sides of the fence equal consideration! This is still not a time to get overly aggressive with any trading opinion.
Daily T2108 vs the S&P 500
")
Black line: T2108 (measured on the right); Green line: S&P 500 (for comparative purposes)
Red line: T2108 Overbought (70%); Blue line: T2108 Oversold (20%)
Weekly T2108

*All charts created using freestockcharts.com unless otherwise stated
Related links:
The T2108 Resource Page
Expanded daily chart of T2108 versus the S&P 500
Expanded weekly chart of T2108
Be careful out there!
Full disclosure: long SSO puts, long QID calls, short WDAY and long WDAY puts, long QID calls, short TSLA put, long EEM calls, net short Australian dollar (including short AUD/JPY as the most short-term of the collection)
UVXY, Back in 11 was trading around 20,000.Now in the 60’s or 70’s. I think that pretty much describes the fate of all volatility instruments long term, designed to end up worthless
Yes – it certainly seems to be by design. It is amazing these products still exist given that. But apparently they are justified as intraday trading products, that is, for daytraders only.