
(T2108 measures the percentage of stocks trading above their respective 40-day moving averages [DMAs]. It helps to identify extremes in market sentiment that are highly gap down to reverse. To learn more about it, see my T2108 Resource Page. You can follow real-time T2108 commentary on twitter using the #T2108 hashtag. T2108-related trades and other trades are posted on twitter using the #120trade hashtag)
T2108 Status: 61.1%
VIX Status: 13.1
General (Short-term) Trading Call: Hold
Active T2108 periods: Day #59 over 20% (overperiod), Day #84 under 70%
Reference Charts (click for view of last 6 months from Stockcharts.com):
S&P 500 or SPY
SDS (ProShares UltraShort S&P500)
U.S. Dollar Index (volatility index)
VIX (volatility index)
VXX (iPath S&P 500 VIX Short-Term Futures ETN)
EWG (iShares MSCI Germany Index Fund)
CAT (Caterpillar)
Commentary
For the second time this year, T2108 has stopped just short of overbought territory. In the wake of Wednesday’s big rally, T2108 closed at 68.9%, just short of overbought territory. Since then, it has backed down all the way to 61.1%, hitting exactly 70.1% on an intraday basis on Thursday. The question now for T2108 followers is whether this is “good enough” to make a play shorting the S&P 500 (SPY). The last time this happened, the S&P 500 just churned in place for a week before a fake breakout to start trading in August. Perhaps in telling fashion, T2108 went nowhere. The S&P 500 sold off for the next 3 weeks before stopping just short of oversold conditions.
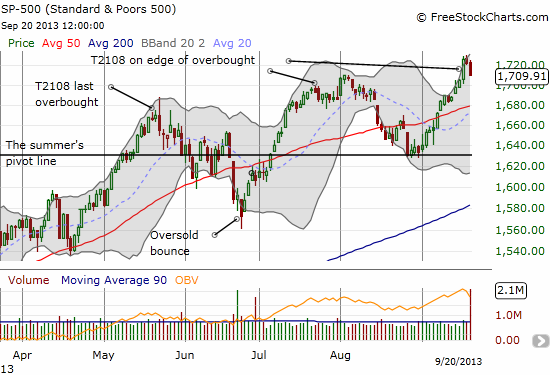
I am honestly torn since I earlier decided I would be VERY slow to pull the trigger on ProShares Ultra S&P 500 (SSO) puts given the overall bullish tone in the current trend. Aggressive traders can short here with a tight stop at fresh highs. I am content to hold here and may re-evaluate if the S&P 500 closes below its 50DMA. Otherwise, I still prefer to only buy puts after T2108 is “deep” into overbought territory.
In the meantime, the S&P 500 has eked out a mere 0.8% gain since it was last overbought. This puts the index’s performance smack in the middle of its expected performance based on the number of days T2108 has traded below 70% (84 days now). The range of potential performances is wide. T2108 is also entering rare territory. The chart below shows that it is not common for T2108 to trade THIS long without entering overbought territory.
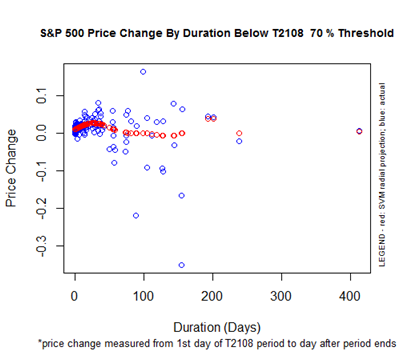
One interpretation of this chart is that buying the dips remains the preferred option. The further the S&P 500 trades down, the more upside created for the next trip to overbought territory. The huge exception of course is a major sell-off. It is quite an extreme of outcomes! By the time I even think about the possibility of a major sell-off, T2108 will hit oversold first. As always, I will take this one step at a time and avoid over-forecasting.
One potentially important long-term consideration is the bearish signal that T2107 continues to flash. T2107 is the percentage of stocks trading above their respective 200DMAs. I only sporadically check it. Surprisingly, T2107 remains locked in a firm downtrend this year even as the S&P 500 has soared.
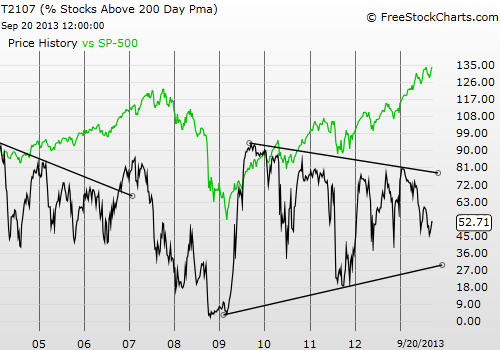
I do not have a model that estimates a breaking point – where T2107 gets so low, the S&P 500 runs out of fuel. But there is plenty of reason to be long-term cautious. It seems to me T2107 needs to turn upward “soon.” When/if it does, look out. The S&P 500 will gain a LOT more upside potential. If T2108 flips overbought with T2107 still heading downward, I will be quicker to pull the trigger on SSO puts.
Daily T2108 vs the S&P 500
")
Black line: T2108 (measured on the right); Green line: S&P 500 (for comparative purposes)
Red line: T2108 Overbought (70%); Blue line: T2108 Oversold (20%)
Weekly T2108

*All charts created using freestockcharts.com unless otherwise stated
Related links:
The T2108 Resource Page
Expanded daily chart of T2108 versus the S&P 500
Expanded weekly chart of T2108
Be careful out there!
Full disclosure: no positions