
(T2108 measures the percentage of stocks trading above their respective 40-day moving averages [DMAs]. It helps to identify extremes in market sentiment that are highly likely to reverse. To learn more about it, see my T2108 Resource Page. You can follow real-time T2108 commentary on twitter using the #T2108 hashtag. T2108-related trades and other trades are posted on twitter using the #120trade hashtag)
T2108 Status: 61.9%
VIX Status: 12.0
General (Short-term) Trading Call: Aggressive traders can open fresh longs on the breakout. Stop below 1700 on the S&P 500.
Active T2108 periods: Day #27 over 20% (overperiod), Day #13 over 60%,Day #54 under 70%
Reference Charts (click for view of last 6 months from Stockcharts.com):
S&P 500 or SPY
SDS (ProShares UltraShort S&P500)
U.S. Dollar Index (volatility index)
VIX (volatility index)
VXX (iPath S&P 500 VIX Short-Term Futures ETN)
EWG (iShares MSCI Germany Index Fund)
CAT (Caterpillar)
Commentary
In the last T2108 Update I noted that the bias was to the upside despite what looked like growing negatives. In particular, I expected the market to do its typical first-day-of-the-month rally. The S&P 500 (SPY) delivered with a nice 1.3% rally on Thursday, August 1st to close at fresh all-time highs. It added a few more points on Friday in what looks like a general stalemate in response to the jobs report.
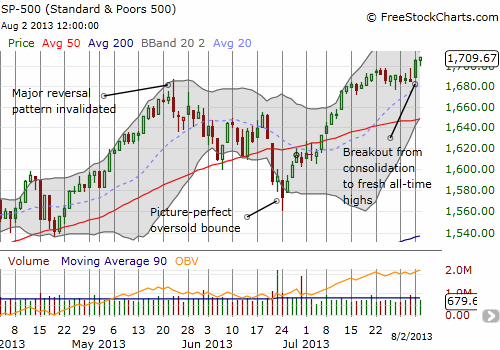
T2108 has barely responded to this move suggesting that the former leaders are continuing the push. T2108 remains a hop, skip, and a jump away from overbought, so, much to the chagrin of unrepentant bears, the market still has room to run on the upside before this move corrects. In particular, hedge funds and the like should be scrambling even more actively in search of lagging stocks to use in their game of market performance catch-up. The S&P 500 is up a head-scratching 19.9% year-to-date; that is a LOT of catch-up for under-performing hedge funds.
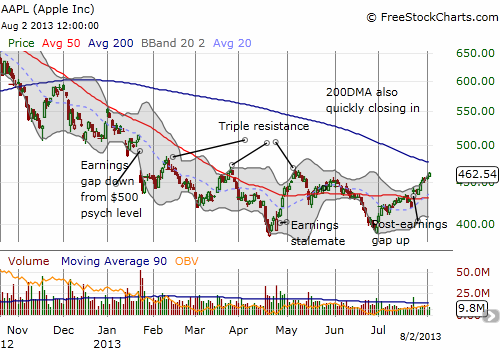
My favorite catch-up stock remains Apple (AAPL). It has been surprising strong in the past week, barely pausing at what should have been stiffer resistance around $455. It is now positioned to break through resistance at $465-470 on its way to a major rendezvous against its 200DMA. Apple last sniffed this resistance at the end of November. Unsurprisingly, the Apple Trading Model (ATM) is firmly predicting an up day for Monday, August 5th.
Speaking of the ATM, I have now generalized the model such that I can use it on any stock in search of tradeable cyclical and precedence-type patterns. Now I understand why quants have so much fun. Stay tuned for more on developments here. I want to next turn the model’s guns on Google (GOOG). And speaking of GOOG, as I feared it might, my weekly calls expiring last Friday went out as a bust. My monthly 915/925 call spread looks much more promising and is in the green now.
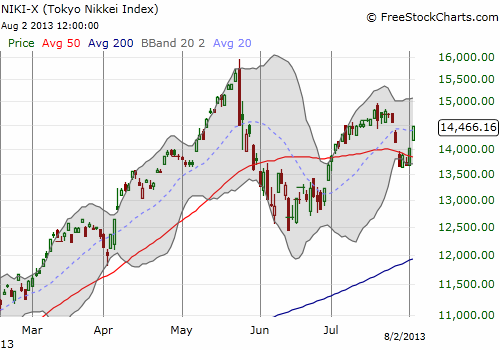
Almost all the looming negatives I noted in the last T2108 Update have either been neutralized or invalidated. In particular, the Nikkei smashed through resistance at the 50DMA and is roaming free to rally again. This breakout started as the Japanese yen (FXY) weakened notably against the U.S. dollar on Thursday.
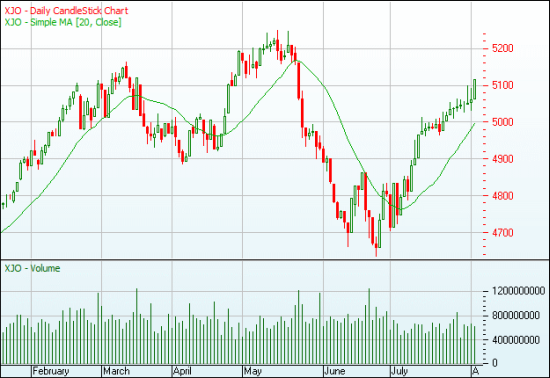
Even the looming negative of a plunging Australian dollar (FXA) looks much less negative given the Australian stock market is finally responding with a rally that has accelerated in the past week. I will be posting a piece dedicated to the short-term prospects of the Australian dollar soon. I think it is poised for a major relief rally.
Daily T2108 vs the S&P 500
")
Black line: T2108 (measured on the right); Green line: S&P 500 (for comparative purposes)
Red line: T2108 Overbought (70%); Blue line: T2108 Oversold (20%)
Weekly T2108

*All charts created using freestockcharts.com unless otherwise stated
Related links:
The T2108 Resource Page
Expanded daily chart of T2108 versus the S&P 500
Expanded weekly chart of T2108
Be careful out there!
Full disclosure: long AAPL shares and puts; short FB and long FB puts; long EEM puts and put spread; long VXX; net short Australian dollar, net long Japanese yen