
(T2108 measures the percentage of stocks trading above their respective 40-day moving averages [DMAs]. It helps to identify extremes in market sentiment that are highly gap down to reverse. To learn more about it, see my T2108 Resource Page. You can follow real-time T2108 commentary on twitter using the #T2108 hashtag. T2108-related trades and other trades are posted on twitter using the #120trade hashtag)
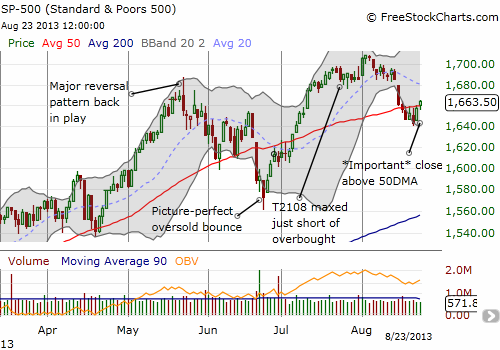
T2108 Status: 38.7%
VIX Status: 14.0 (breakdown creating a false breakout)
General (Short-term) Trading Call: Hold. Aggressive traders can play move above 50DMA.
Active T2108 periods: Day #42 over 20% (overperiod), Day #6 under 40% (underperiod), Day #66 under 70%
Reference Charts (click for view of last 6 months from Stockcharts.com):
S&P 500 or SPY
SDS (ProShares UltraShort S&P500)
U.S. Dollar Index (volatility index)
VIX (volatility index)
VXX (iPath S&P 500 VIX Short-Term Futures ETN)
EWG (iShares MSCI Germany Index Fund)
CAT (Caterpillar)
Commentary
It is starting to look like 30% will once again serve as a bottom for T2108. As I mentioned in the last T2108 Update, I purposely ignored the apparent dangers of last week’s 50DMA breakdown in favor of playing the odds for a bounce from quasi-oversold conditions. Now, the S&P 500 (SPY) has crept above the 50DMA, making last week’s break look like another potential fake-out.
While the S&P 500 looks like a potential fake-out on the breakdown side, the volatility index, the VIX, is looking like a potential fake-out on the breakout side.
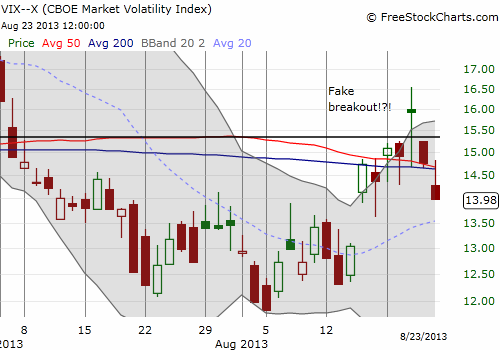
This breakdown reinforces the potential for the S&P 500 to rally further from here. The VIX is once again below the pivot point AND its 50 and 200DMAs.
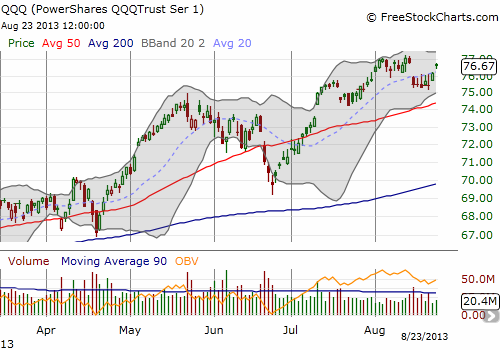
I am now back to even on my ProShares Ultra S&P 500 (SSO) calls which means I was not aggressive enough on the second tranche of buys. Of course, I could not have known what exactly was coming, and I was reserving powder for a potential third tranche. I am firmly in the green on the PowerShares QQQ Trust (QQQ) calls partially thanks to Friday’s surge in Microsoft (MSFT) on the overdue news of CEO Steve Ballmer’s imminent retirement. These call options were purchased aggressively as my first quasi-oversold play. QQQ (and the NASDAQ) is currently looking even healthier than the S&P 500 with a completed gap fill.
Daily T2108 vs the S&P 500
")
Black line: T2108 (measured on the right); Green line: S&P 500 (for comparative purposes)
Red line: T2108 Overbought (70%); Blue line: T2108 Oversold (20%)
Weekly T2108

*All charts created using freestockcharts.com unless otherwise stated
Related links:
The T2108 Resource Page
Expanded daily chart of T2108 versus the S&P 500
Expanded weekly chart of T2108
Be careful out there!
Full disclosure: long SSO and QQQ calls