
(T2108 measures the percentage of stocks trading above their respective 40-day moving averages [DMAs]. It helps to identify extremes in market sentiment that are highly gap down to reverse. To learn more about it, see my T2108 Resource Page. You can follow real-time T2108 commentary on twitter using the #T2108 hashtag. T2108-related trades and other trades are posted on twitter using the #120trade hashtag)
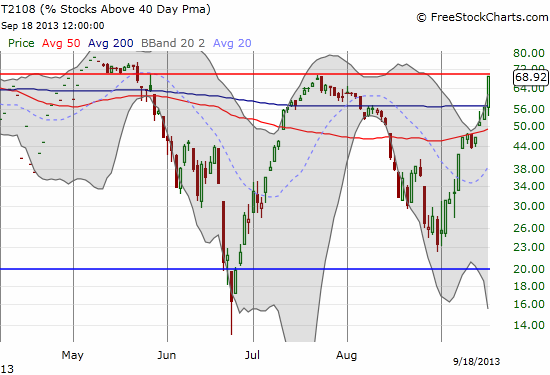
T2108 Status: 68.9%
VIX Status: 13.6
General (Short-term) Trading Call: Take more off the table. Otherwise, hold.
Active T2108 periods: Day #57 over 20% (overperiod), Day #82 under 70%
Reference Charts (click for view of last 6 months from Stockcharts.com):
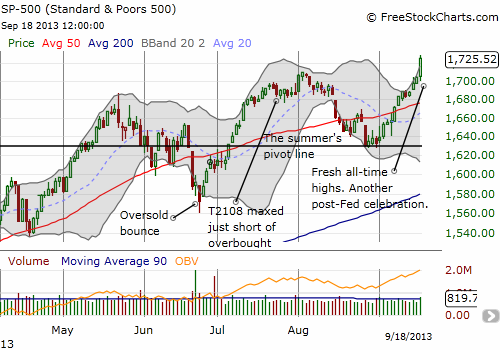
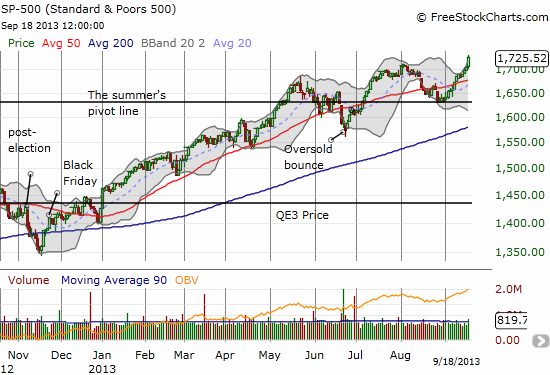
S&P 500 or SPY
SDS (ProShares UltraShort S&P500)
U.S. Dollar Index (volatility index)
VIX (volatility index)
VXX (iPath S&P 500 VIX Short-Term Futures ETN)
EWG (iShares MSCI Germany Index Fund)
CAT (Caterpillar)
Commentary
When T2108 is closing in on overbought or oversold conditions, I am typically pretty good at anticipating approximately when the magic moment will happen (or something close!). This time around, overbought territory was not even on my radar. Even as it moved up to 56.4% on Tuesday, September 17, the thought honestly did not even cross my mind. Yet, here we are. T2108 surged 22% (12 percentage points) to close at 68.9%, right on the edge of overbought territory. Here is the intraday chart to make the surge to this point dramatically clear.
In parallel, the S&P 500 made an impressive move, gaining 1.2% to close at a fresh all-time high. The bounce from “almost oversold” conditions has been sharp and persistent – almost as if stock traders KNEW the Federal Reserve would not dare begin tapering this month.
If you are still a bear after seeing this price action and momentum, you are still betting on hope. This does not need to make sense. It is what it is: a market that gets bought on the dips until it proves otherwise. Since the post-election lows (November, 2012), the S&P 500 has made a series of higher lows and higher highs. The trickiest spot was the oversold milestone in late June where the 50DMA broke in dramatic fashion.
T2108 works wonders under these conditions because oversold and quasi-oversold conditions represent true extremes in the amount of gunpowder that sellers can wield before buyers come rushing back in to snap up the “bargains.” The fascinating part of this run is that only a small part has occurred in overbought conditions. If/when T2108 flips to overbought, I will have to train muscles I have yet to use in the T2108 Trading Model (TTM) era. However, I am pretty certain that I will be very slow to buy puts on the SSO in an overbought phase.
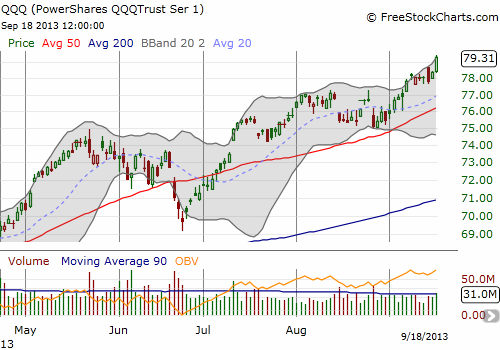
Today’s surge took me out of my PowerShares QQQ Trust (QQQ) call options with a solid 115% gain. (Recall, I sold my SSO calls last week. I am trying not to think of how much more THOSE would have been worth today).
This was another journey that unfolded way off-script. While doubling down on the QQQ calls helped deliver my large upside, I watched the original position whittle down by 2/3 before it bottomed. I did not triple down because I had planned to restart once T2108 hit oversold; it never did. Instead, I watched the position slowly recover, gain 50% at one point last week, flatten out again into a small loss on Monday, and then deliver ALL my final gains in one celebratory day. Such are the vagaries of trading.
Hopefully, you have followed along closely this past month or so (you readers are a very silent bunch, so I have to imagine you are also benefiting from these trades =smile=). It was a definite learning experience, and it demonstrated the power of thinking of the stock market (the S&P 500) as trading through and in different phases of T2108 10 percentage points. I was quite stubborn in holding this position partially because I was anchored by a bet I had with some friends about where the NASDAQ would close out September. It looks like I will win (NASDAQ at 3800 with a high of 3900), but note that the lesson is NOT to be stubborn, especially about losing positions. Instead, it is to follow and execute the rules. I learn this lesson over and over and over again.
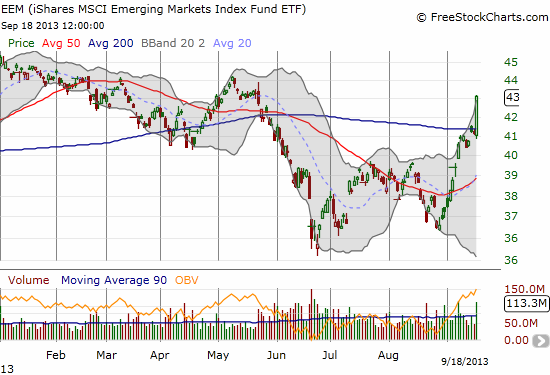
Finally, iShares MSCI Emerging Markets ETF (EEM) remains on my radar. As I mentioned in the last T2108 Update, I think it is time to stop using EEM as a hedge and instead look at it as its own potentially profitable trading vehicle. After today’s 4.2% breakout above 200DMA resistance, I think the straddle strategy from Schaeffer’s Investment Research makes a LOT of sense. I wish I had started it yesterday. In the meantime, I have some worthless September puts and some wilting October puts awaiting company.
Daily T2108 vs the S&P 500
")
Black line: T2108 (measured on the right); Green line: S&P 500 (for comparative purposes)
Red line: T2108 Overbought (70%); Blue line: T2108 Oversold (20%)
Weekly T2108

*All charts created using freestockcharts.com unless otherwise stated
Related links:
The T2108 Resource Page
Expanded daily chart of T2108 versus the S&P 500
Expanded weekly chart of T2108
Be careful out there!
Full disclosure: long EEM puts