
On Monday, I was QUICK to declare “a very bearish breakdown for Apple.” Just two days later, the stock has recovered all of Monday’s huge loss and sits on the cusp of a very encouraging recovery or at the precipice of a renewed sell-off. The stock is neatly perched between its 50 and 200-day moving averages (DMA), a potentially pivotal crossroads, especially as it rests right below the open on the day Icahn tweeted his support for AAPL.
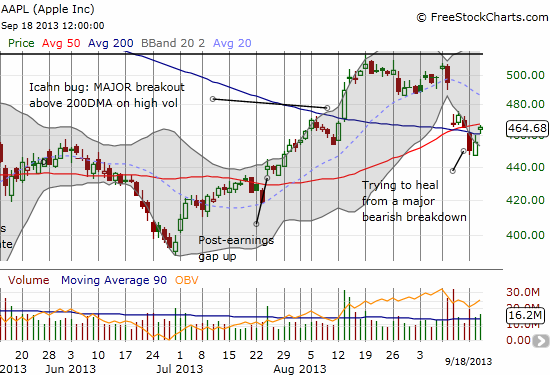
Source: FreeStockCharts.com
As I stated in my previous Apple post, the bearish technicals forced me to “turn off” the The Apple Trading Model (ATM) and only trade it when it flashes a sell signal. I had to grit my teeth the last two days as the model gave very high odds of up days. I grit even harder as the call options I bought on Friday to play Monday upside barely benefited from the 2-day bounce that delivered yet more validation of the model. So, it was a double whammy of missing out on nice gains.
Now, the ATM is flashing high odds (71%) of a down close on Wednesday. Moreover, ALL three supporting models (using data going back to 2010) are predicting a down day; the 2011 and 2012 models are predicting even higher odds of a down day. This is where the rubber hits the road as the news and headline cycle continues with Apple’s rollout of iOS7 and pre-order numbers likely to come ahead of Friday’s big days for iPhone 5C and 5S.
Either way AAPL breaks, up or down, I will return to following the ATM.
Be careful out there!
Full disclosure: long AAPL shares, calls, puts