(T2108 measures the percentage of stocks trading above their respective 40-day moving averages [DMAs]. It helps to identify extremes in market sentiment that are highly likely to reverse. To learn more about it, see my T2108 Resource Page. You can follow real-time T2108 commentary on twitter using the #T2108 hashtag. T2108-related trades and other trades are posted on twitter using the #120trade hashtag)
T2108 Status: 39.3%
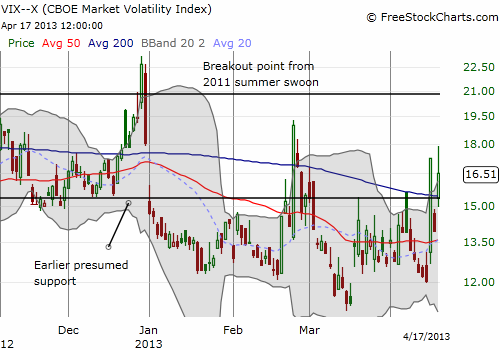
VIX Status: 16.5 (an 18.3% increase!)
General (Short-term) Trading Call: Buy for a bounce off 50DMA only
Reference Charts (click for view of last 6 months from Stockcharts.com):
S&P 500 or SPY
SDS (ProShares UltraShort S&P500)
U.S. Dollar Index (volatility index)
VIX (volatility index)
VXX (iPath S&P 500 VIX Short-Term Futures ETN)
EWG (iShares MSCI Germany Index Fund)
CAT (Caterpillar)
Commentary
The sharp churn continues in the stock market. The S&P 500 (SPY) closed down 1.4% after bouncing cleanly off its 50-day moving average (DMA). Adding to the “magic” is a close that exactly matches Monday’s close and Tuesday’s open. This is the same level that dominated trading from April 3rd to the 8th.

While the S&P 500 has gone exactly nowhere since Monday’s calamitous close, the VIX has lost some ground after spiking again today. It pulled back after surpassing Monday’s high – an early sign the selling pressure may already be receding to leave the 50DMA support intact.

T2108 is down by a rounding error from Monday’s close. At 39.3% it has yet again crossed through two major T2108 threshold levels. It is now in the 40% under-period. Unlike Monday, T2108 is not quasi-oversold since the previous day featured a large increase in T2108 (from 40.7% to 50.1%). So, my anticipation of a bounce is not as strong as Monday’s when I used the T2108 Model to predict an increase for the S&P 500 with an 80% probability. That accurate forecast is the next step in solidifying the validity of my overhaul of using T2108. This time, the odds favor a bounce just based on old-fashioned technicals with the 50DMA support and a second day out of three featuring a strong move upward in the VIX, ending in a significant pullback from highs. Per my nascent VXX-strategy, I added to my puts as a hedge against my VXX shares. If VXX soars again soon, I will lighten up on the shares in at least enough quantity to pay for the puts.
In other trading news, I added to my SSO calls today in line with my thinking above. This is in addition to calls I bought near the open on Tuesday. Note that I did not lock in profits from my accurate forecast using the T2108 Model. I definitely appreciate the irony of making a nice profit when my 1-day forecast was wrong (I sold the puts on the 2nd day when the S&P 500 sold-off sharply) and failing to lock in profits when it turned out correct. However, these SSO calls do not expire until May, and I am looking a little forward in anticipation of at least one more significant move higher. Perhaps I am over-extending myself. Time will soon tell.
I am watching many other signs, four of which are Caterpillar (CAT), Intel (INTC), the Australian dollar (FXA), and, of course, Apple (AAPL). Let’s do a quick chart review.
CAT is close to retesting its 52-week lows. Today, it managed to bounce of intra-day lows and form a hammer. If it can bounce from here, CAT moves from being a negative sign on the market to a hopeful one.

Intel (INTC) surprised me by reporting in-line. I went into earnings with a fistful of puts waiting to cash in. I thought certainly last week’s dire news from IDC on PC sales would weigh on INTC’s results. Not only did the stock survive earnings, but it soared into the close, reversing early losses. Granted, the 200DMA looms overhead as resistance, and the stock pulled back to close even on the day, but this is a stock that definitely should have joined the overall malaise of the day.

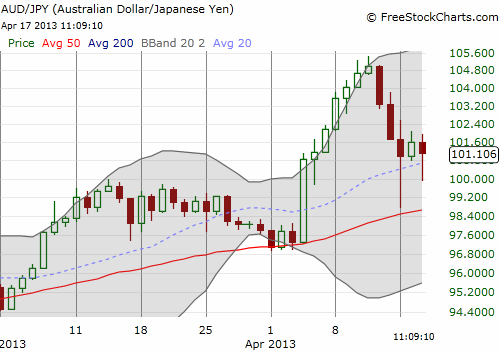
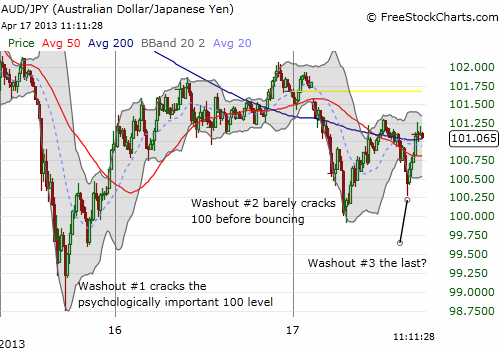
The Australian dollar was pounded following disappointing economic news out of China. It continues to trade below the 200 and 50DMAs and cracked fresh post-data lows against the U.S. dollar. The dollar index soared today 1.2%, so on a relative basis, the Aussie did not fare too badly. The Aussie still has a lot to prove, but the story against the Japanese yen (FXY) provides some hope. The flight to “safety” in the yen seems to already be losing steam (as it should), and AUD/JPY did NOT crack new post-data lows. In fact, a bounce off the 50DMA is still holding. I am posting the daily chart to show this support. The following intra-day chart is even more informative as it clearly shows that the last two washout moves to the downside fell far short of retesting the first one – an encouraging sign of receding selling pressure and a potential precursor to a massive rally to complete the reversal of post-data losses throughout forex.


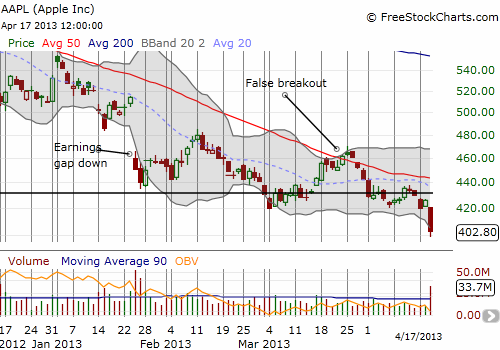
Apple (AAPL) has long become a persistent disappointment. However, by sticking to my Apple trading model, I got the occasional big trading day that I expect to achieve with patience that is as persistent as the downtrend. In anticipation of a weak close to the week, I came into Wednesday’s disastrous plunge prepared with a thimble-full of puts that soared in value. I tried to wait out the selling as long as I could before bailing around $408. While I left a LOT of profit on the table, there is simply no way I was going to anticipate a loss of 5.5% on the close, much less a 6% loss at the lows. (As always, see my tweets on AAPL to follow my real-time forecasts of short-term movements. In today’s trading, I noted that the new 52-week lows placed Apple at risk to “easily” hit $400…but I was NOT anticipating that to happen in one day!).
I am now repositioned for a potential calamity (not likely) or a sharp rebound (more likely given Apple’s tendency to bounce within 1 or 2 days of a plunge below the lower-Bollinger Band) using a small amount of the profits from the original puts and another put that I flipped during the day. Earnings are next week. I hope to post an update to my quarterly technical analysis of the Apple earnings trade over the weekend.
Finally, here is the AAPL chart in all its ugliness. While I freely bet against Apple from time-to-time, I am still a stubborn shareholder (a very small one), so I do feel some of the pain of you Apple loyalists who are still out there.

Apple is now in what I am calling “the red zone.” It is an area are never thought I would see Apple revisit, and I find it quite alarming. I began to fear this red zone when I wrote “Apparent Lack Of Negative Sentiment On Apple Makes It Hard To Call A Bottom.” A refresh of my sentiment analysis will be a part of my pre-earnings review. I will be more optimistic if I see more pessimism (classic contrarian thinking).
I expect the rest of the week to test traders’ nerves just as much as the first three days. Brace yourself and trade favoring caution over confidence.
Daily T2108 vs the S&P 500

Black line: T2108 (measured on the right); Green line: S&P 500 (for comparative purposes)
Red line: T2108 Overbought (70%); Blue line: T2108 Oversold (20%)
Weekly T2108

*All charts created using freestockcharts.com unless otherwise stated
Related links:
The T2108 Resource Page
Expanded daily chart of T2108 versus the S&P 500
Expanded weekly chart of T2108
Be careful out there!
Full disclosure: long VXX shares, calls and puts; long AUD/JPY (net long Australian dollar); net short Japanese yen; long AAPL shares, calls, and puts; long SSO calls; long INTC puts; long CAT shares and put spread

Dr. Duru,
Good synopsis of current market action, I follow from SA. Thanks for alerting readers on the T2108 metric; I now follow it. A few comments/questions:
*The T2108 metric has not been such a good indicator for market sells: in Jan/Feb there was a sell indicator, but had one sold that would have meant missing the gains from Feb-April (nearly 6%). The metric appears to be a better buy indicator, cf. Jun/Jul’12 and mid-Nov’12. Perhaps the current sharp action to the downside will emit another buy signal when the metric trends below your blue line.
*Which brings me to my point made on SA: this looks to be a rangebound market, and perhaps T2108 at its buy signals can alert swing traders to a floor on the channels. The channel looks uptrending for now, due to a number of dynamic factors.
*CAT is an excellent choice for a sentiment indicator; I just so happen to have tracked it for years. Right now it is hitting near 52 week lows, and off AH today (4/18). If it pierces the $79.64 floor from last July, the next stops are potentially $70 and then $65. This is a key pivot to watch, just as the FDX pivot was last year for the trannies.
*I have made money on the JPY short, but the AUD long looks vulnerable, or at least flat from here. What will move AUD higher?
*Why not replace AAPL and INTC with better breeds: GOOG and QCOM, or at least add them?
*Why own VXX: this is a broken product, even if you supplement the long with puts to account for various drag factors (contango-ETF construction, tracking errors, etc). Why not trade VIX options or futures?
Thanks again for a thought-provoking blog.
Thank you for the extensive reply! Some responses:
1. T2108 is definitely much better with buy signals than sell signals. Part of my overhaul was an attempt to fix that. I ended up coming up with yet one more case that provides good buy signals! And yes, today is a quasi-oversold day. I will run the model tonight for a preidction but I suspect options expiration will keep things relatively flat. Explosive rally on Monday perhaps.
2. AUD only moves higher by a chase for higher yield…and whenever people stop panicking over China!
3. I like your idea of tracking GOOG and QCOM, but I am not yet ready to drop AAPL and INTC. I used to follow GOOG a lot more closely and have lost tough with it lately. QCOM intrigues me a lot, and I have bought dips in the recent past. I like INTC as an old-fashioned tech cyclical. It’s ability to rally post-earnings in a show of relative strength has me even more interested ow.
4. VXX is truly garbage. I make almost all money from buying and selling puts on it. The shares now are just a very small position to caputre big moves up like these past three days. I actually think now is finally a time to dump the shares permanently. Thanks for the reminder. Not sure I want to dabble in futures.
Thanks for reading!
— Duru