
AT40 = 44.9% of stocks are trading above their respective 40-day moving averages (DMAs)
AT200 = 48.9% of stocks are trading above their respective 200DMAs
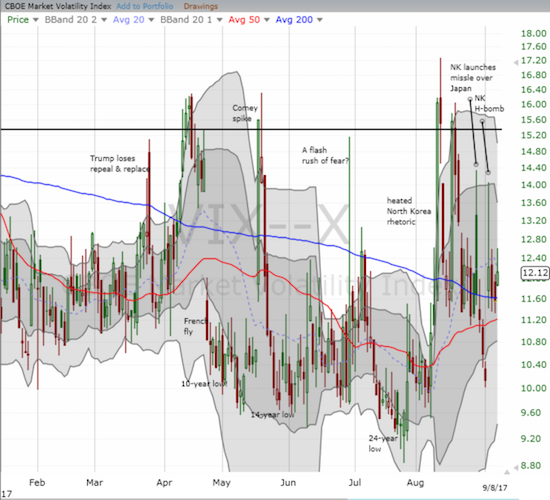
VIX = 12.1 (up 4.9%)
Short-term Trading Call: neutral
Commentary
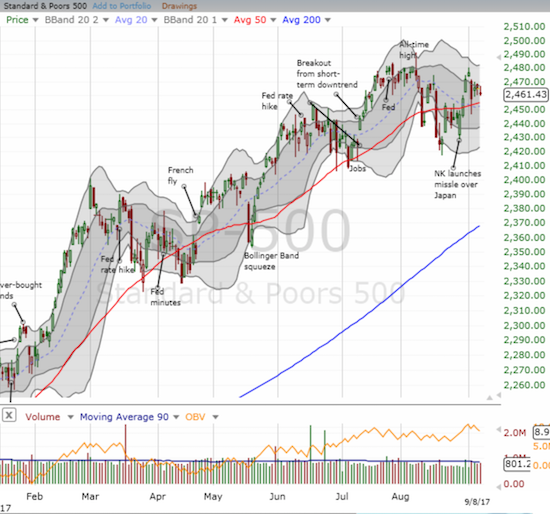
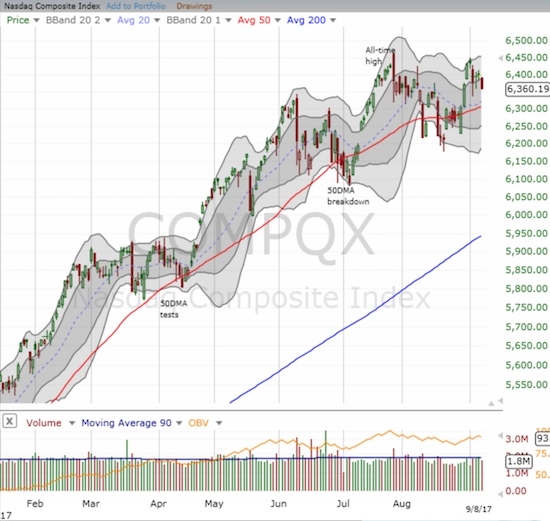
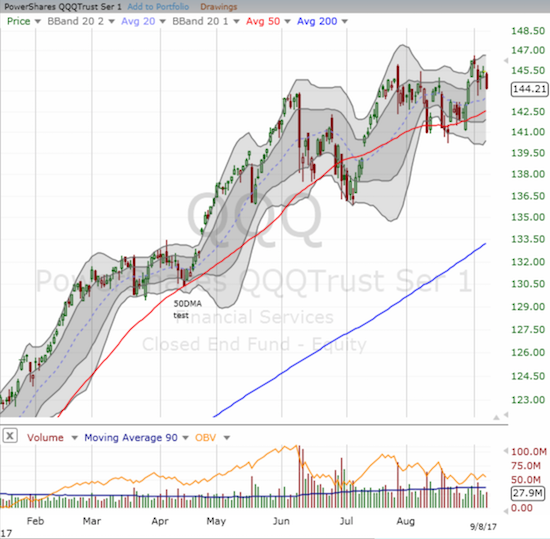
The market has made no progress since my last Above the 40 post which covered the volatility and fizzle from Tuesday, September 5th. Tensions remain given the volatility index, the VIX, closed the week with a gain on the day and remains well above last Friday’s extreme low of 10.1. The S&P 500 (SPY) lost fractionally and closed down for the week for what is three weekly losses over the last 5 weeks. The NASDAQ is actually down 5 of the last 7 weeks. The same for the PowerShares QQQ Trust (QQQ). If not for the large rally last week, these indices would look bearish.
AT40 (T2108), the percentage of stocks trading above their 40-day moving averages (DMAs), managed to avoid closing at its low for the week…just barely. Like the indices, it held onto much of its gains from the previous week’s rally. As a result, there is still no reason to get (short-term) bearish even as the reasons for bullishness are similarly weak. The market is in a stalemate awaiting the next catalyst. With the debt ceiling fight kicked down the road for another day, a key tell will be the market’s reaction to the next North Korean missile/nuke test. The time may already have arrived where the market will generally ignore these actions, and even the words out of Washington in response. Only action from the U.S. may stir the pot all over again in financial markets.
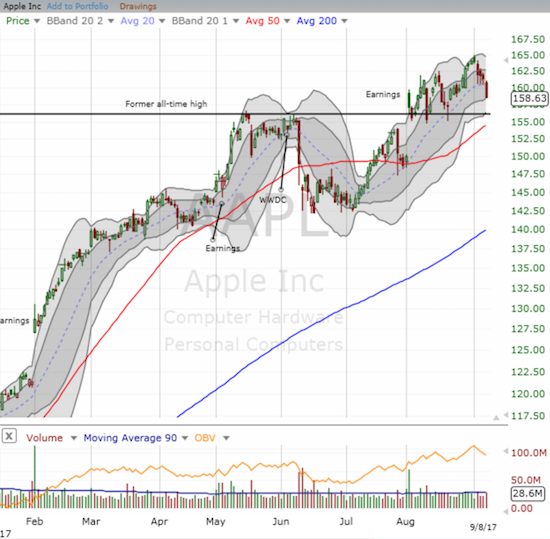
It was a mixed week for trades. I took losses on my Apple (AAPL) call options as a bottoming pattern at 20DMA support gave way to a 1.6% slide and violation. For three straight days, AAPL neatly bounced off 20DMA support. If I had a selling strategy on AAPL, I would have quickly purchased put options when the 20DMA support line broke. Instead, I dutifully reloaded on a call option for next week. I will look to get out before Apple’s product announcements since the stock typically fades after these events.
Speaking of disappointments, Chipotle Mexican Grill (CMG) got hammered by another dour analyst note. CMG lost a whopping 5.4% on high volume; I honestly did not think enough motivated sellers remained in the stock to take it down so steeply in one day. Fortunately, my trade on CMG worked out well as I moved quickly to take profits on a surge that reversed almost all the stock’s loss from Tuesday. Since CMG did not make a new low, I almost pulled the trigger on another call option. However, I stood down. Friday’s action was very bearish with a significant gap down and a subtle, yet meaningful, widening of the lower Bollinger Band (BB). While playing the even number game at $300 seems tempting, I prefer to wait for a fresh confirmation of CMG’s bottoming – whether it is a sharp bounce before the low of $297 gets breached or a complete reversal and follow-through from Friday’s loss.

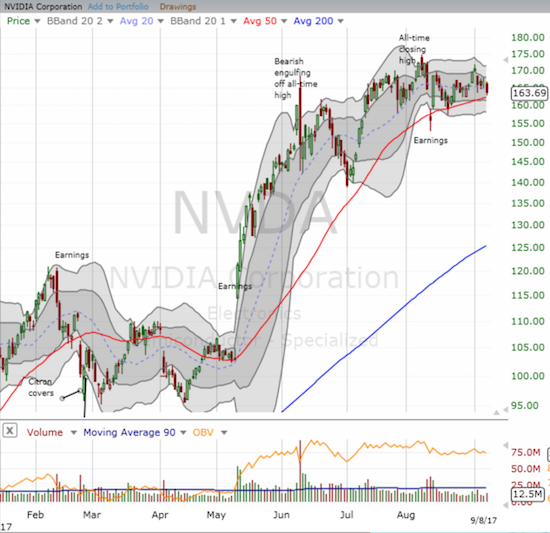
Instead of taking another flyer on CMG, I turned to a stock that remains in a strong uptrend: NVIDIA (NVDA). The stock lost 1.7% on the day and closed just above its 50DMA support. This line of support has served NVDA well ever since the big post-earnings gap up in May. Interestingly, trading volume remains relatively low for NVDA.
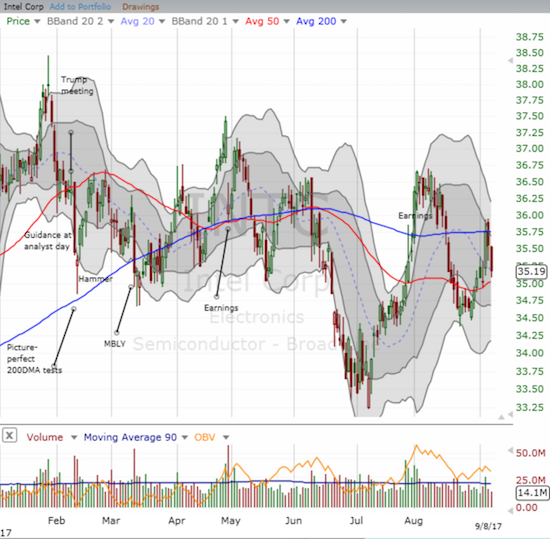
It was a wild week for Intel (INTC). I made a timely entry for my “between earnings” trade on INTC. After INTC retested 50DMA support on Tuesday, it soared on Wednesday. I decided to take my profits as INTC hit its 200DMA resistance although my trade was supposed to last a few more weeks longer. INTC proceeded to fade hard the next two days. The stock is now retesting 50DMA support, and I am looking to reload on the between earnings trade.
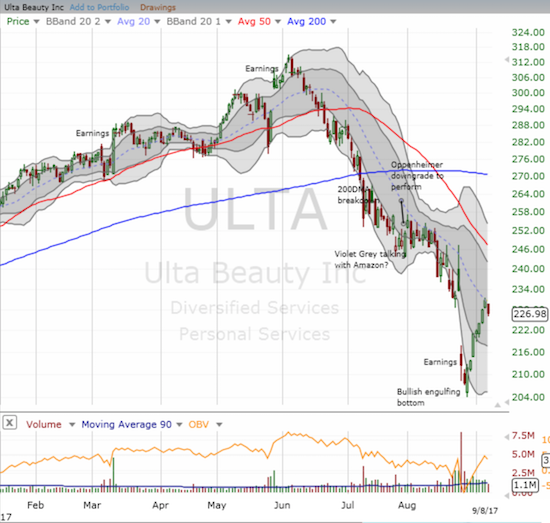
Ulta Beauty (ULTA) was a big win that I described in earlier posts. I sold my shares Friday as the stock reversed off resistance off its 20-day moving average (DMA). Given the steep ascent from the low at the end of August, ULTA is very vulnerable to a “natural” setback as the latest buyers exhaust themselves.
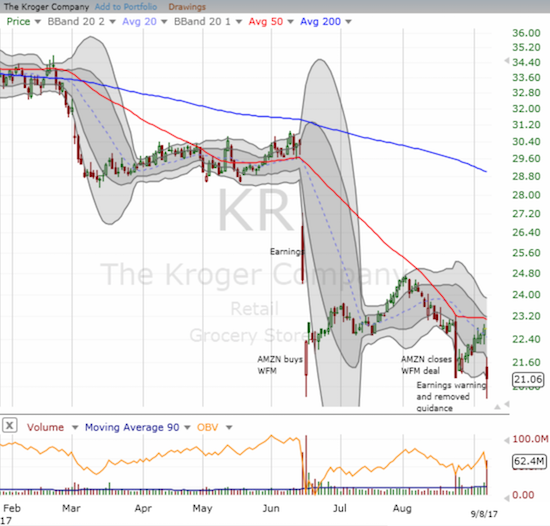
Kroger (KR) was one of the big disappointments on Friday. The company reaffirmed existing guidance but announced it would no longer provide “longer-term” guidance. That news was enough to motivate sellers to take down KR to the tune of a 7.5% loss. The only saving grace was that the intraday low did not breach June’s intraday low and the stock closed at the same closing low from August. I am sticking by this trade and investment.
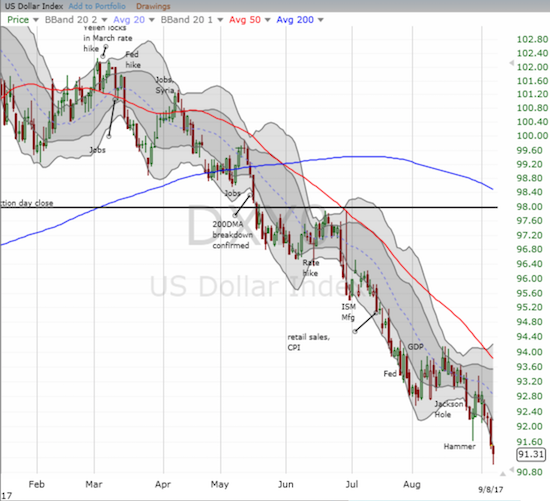
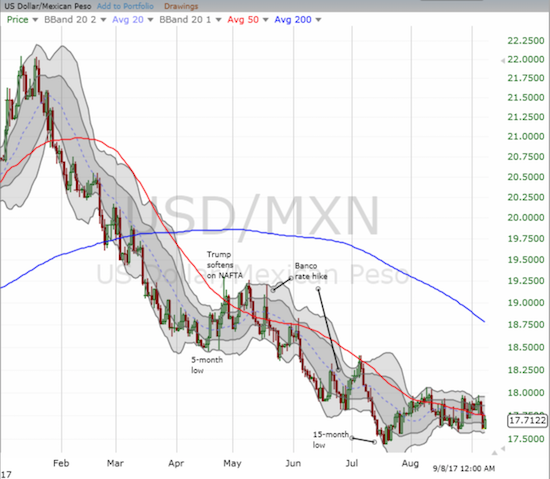
The U.S. dollar index (DXY0) took a fresh beating this week thanks to a euro (FXE) soaring on the backs of a European Central Bank (ECB) preparing to tighten monetary policy. The likely economic damage from two (or more!?!) massive hurricanes should force the Fed to further postpone rate hikes and thus add more lead weights to the U.S. dollar’s value. The bottom that I pointed out for the dollar at the end of August was confirmed but had zero follow-through. I remain as bullish as ever on the euro. The Canadian dollar (FXC) has returned as a preferred anti-dollar trade for me. Interestingly, the main change in the positioning of currency speculators last week occurred with the Mexican peso where net long contracts moved to a fresh 4+ year high. The move makes me expect fresh lows for USD/MXN.
— – —
FOLLOW Dr. Duru’s commentary on financial markets via email, StockTwits, Twitter, and even Instagram!
“Above the 40” uses the percentage of stocks trading above their respective 40-day moving averages (DMAs) to assess the technical health of the stock market and to identify extremes in market sentiment that are likely to reverse. Abbreviated as AT40, Above the 40 is an alternative label for “T2108” which was created by Worden. Learn more about T2108 on my T2108 Resource Page. AT200, or T2107, measures the percentage of stocks trading above their respective 200DMAs.
Active AT40 (T2108) periods: Day #392 over 20%, Day #206 over 30%, Day #6 over 40% (overperiod), Day #23 under 50% (underperiod), Day #29 under 60%, Day #152 under 70%
Daily AT40 (T2108)
")
Black line: AT40 (T2108) (% measured on the right)
Red line: Overbought threshold (70%); Blue line: Oversold threshold (20%)
Weekly AT40 (T2108)

*All charts created using freestockcharts.com unless otherwise stated
The charts above are my LATEST updates independent of the date of this given AT40 post. For my latest AT40 post click here.
Related links:
The T2108 Resource Page
You can follow real-time T2108 commentary on twitter using the #T2108 or #AT40 hashtags. T2108-related trades and other trades are occasionally posted on twitter using the #120trade hashtag.
Be careful out there!
Full disclosure: long KR calls and short puts, long AAPL call, long NVDA calls, short and long various currency pairs versus the U.S. dollar
*Charting notes: FreeStockCharts.com uses midnight U.S. Eastern time as the close for currencies. Stock prices are not adjusted for dividends.