
AT40 = 44.1% of stocks are trading above their respective 40-day moving averages (DMAs)
AT200 = 48.5% of stocks are trading above their respective 200DMAs
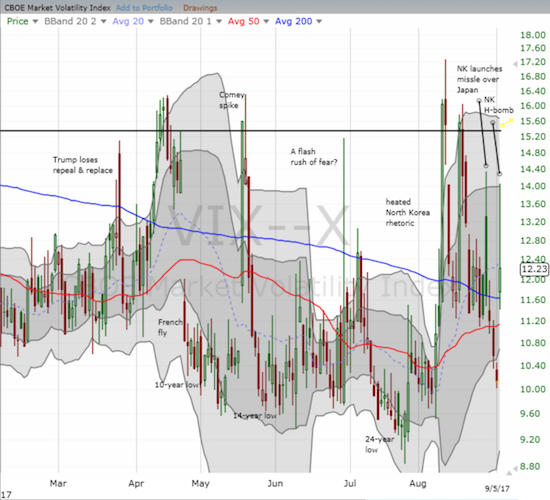
VIX = 12.2 (was as high as 14.1)
Short-term Trading Call: neutral
Commentary
Another North Korean nuclear power move caused more rattling in financial markets. The last time the market cared about the growing drama on the Korean peninsula was August 29th. At that time, the S&P 500 (SPY) gapped down at the open, and the volatility index (the VIX) gapped up. By the close, all was well again as buyers quickly stepped in. The S&P 500 closed flat on the day, and the VIX ended the day with a tiny gain. I called my post for that day “More Stock Market Volatility and Fizzle.”
THIS time around markets reacted differently: the residue of fear actually lingered into the close. Financial markets had plenty of time to adjust, but they did not quite do so. The news of North Korea’s test of a hydrogen bomb came on Saturday, September 2nd; U.S. markets did not trade on Monday because of the Labor Day holiday. European and Asian markets were mixed by the time U.S. traders returned for what marks the official end of summer trading. The volatility index gapped up significantly, but the S&P 500 opened just slightly down. The gap buyers showed up a little late – after about the first 15 minutes of trading – but it seemed like the typical “volatility and fizzle” was underway. Instead, around 10:25am Eastern, the sellers moved in again and managed to create some cascading selling until just after lunch (I guess the sellers decided to take their lunch and run?). While buyers controlled the action the rest of the way and pushed the S&P 500 back over its 50DMA support, the index still lost 0.8% on the day. The VIX suffered a huge fade of its high but still ended up with a 20.7% gain – that gain was exaggerated by the intense pressure the VIX suffered last week after fading from the last volatility and fizzle driven by North Korea.
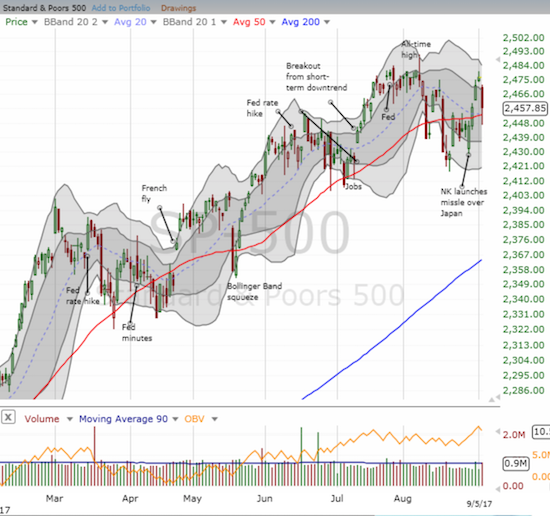
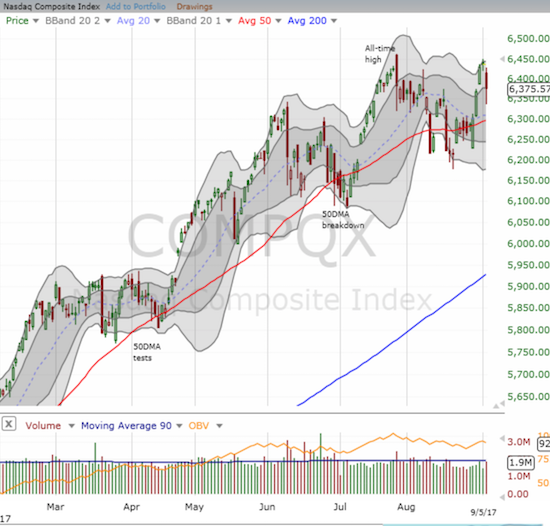
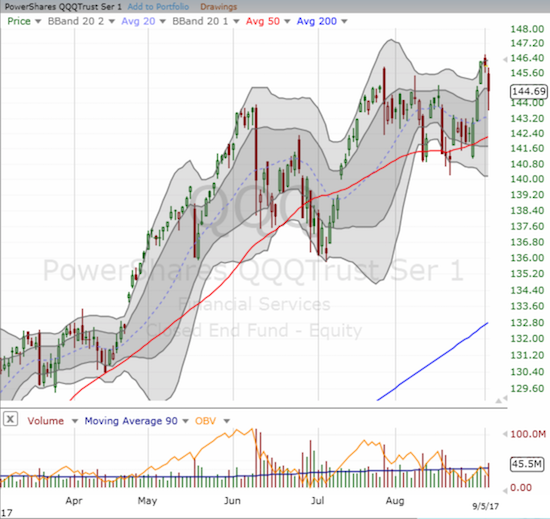
The NASDAQ and the PowerShares QQQ Trust (QQQ) lost 0.9% on the day and bounced similarly alongside the S&P 500.
AT40 (T2108), the percentage of stocks trading above their respective 40-day moving averages (DMAs) lost over 5 percentage points to close at 44.1%. In an interesting coincidence, it fell perfectly from its own 50DMA. I do not think that is significant in of itself but the tumble was strong enough to seemingly end the recent run-up (twice) from “close enough” oversold levels.
The trading to start the open was surprisingly slow enough for me to make a variety of adjustments. I took profits on several long positions including call options on Target (TGT) and the iShares Silver Trust (SLV). TGT actually closed the day UP 2.0% (I kept my shares as they are a longer-term anti-AMZN panic play). SLV gained 1.1% and closed above its upper-Bollinger Band (BB). I remain very bullish on gold and silver here as explained in my last post on the precious metals (“Speculators Add to Expectations for Higher Gold and Silver“). I will keep buying dips with call options until the thesis expires.
As the day wore on, I decided to make some tentative buys and new hedges. I bought two tranches of Apple (AAPL) call options; I did not make my weekly play on Friday given the intervening three-day weekend which promised to destroy more time premium than usual. I felt naked going into the Labor Day weekend without any call options on ProShares Ultra VIX Short-Term Futures ETF (UVXY), so I was relieved when the market met my low ball offer on a call option near the open. When UVXY soared soon thereafter toward its 50DMA, I felt compelled to take the profits: I just do not trust rallies in UVXY to last, especially under the slow-burning conditions of the day’s open. (UVXY ended the day with a healthy 10.9% gain but a strong fade from a 19.8% gain at the high of the day).
That return to “nakedness” left me searching for a fresh hedge. I found two in put options on Caterpillar (CAT), which was slightly up on the day at the time, and Tesla (TSLA) which was bouncing back from its lows of the day when my lowball offer filled.
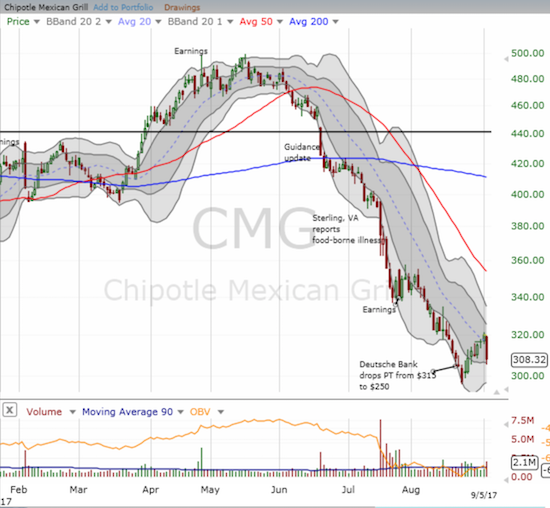
Finally, for pure speculation I returned to buying a call option on Chipotle Mexican Grill (CMG) after kicking myself for missing the short opportunity earlier in the day. CMG fell back down below its downtrending 20DMA in a move that puts an end to its relief rally. Still, I have re-established a bullish bias as CMG met my requirement for two closes above its lower-Bollinger Band (BB) channel. I toss CMG back to the bears on a breach of the previous low.
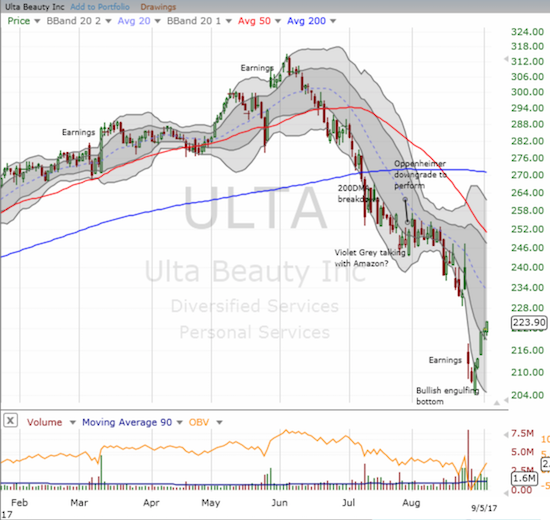
A big surprise to me was the resilience of Ulta Beauty (ULTA). My flip to bullishness proved timely last week as I was able to lock in profits on my call option. I bit my lip and held onto my shares, I expected to see sellers take advantage of the weakness on the day and hit this stock with the same ferocity from the immediate wake of earnings. Instead, ULTA seemed to confirm its change in tone with a fresh post-earnings high and a 1.0% gain on the day.
My short-term trading call remains at neutral. Technically, I came close to pulling the trigger on a switch back to “cautiously bullish.” Last Thursday, the S&P 500 (SPY) traded above my bullish threshold of 2475 but faded from its high of the day. On Friday, buyers tried to close the deal with a close at 2476.55. However, I could not flip my call to cautiously bullish because 1) buyers made such a marginal and tepid close which included a notable fade from the high of the day, 2) given #1, I needed a confirming higher close, and 3) the day before a holiday weekend is a poor time to make a major switch in a short-term trading bias. I am glad I exercised the measured patience. Now let’s see how much more patience the market will grant the growing swirl of negative catalysts surrounding financial markets…
— – —
FOLLOW Dr. Duru’s commentary on financial markets via email, StockTwits, Twitter, and even Instagram!
“Above the 40” uses the percentage of stocks trading above their respective 40-day moving averages (DMAs) to assess the technical health of the stock market and to identify extremes in market sentiment that are likely to reverse. Abbreviated as AT40, Above the 40 is an alternative label for “T2108” which was created by Worden. Learn more about T2108 on my T2108 Resource Page. AT200, or T2107, measures the percentage of stocks trading above their respective 200DMAs.
Active AT40 (T2108) periods: Day #389 over 20%, Day #203 over 30%, Day #3 over 40% (overperiod), Day #20 under 50% (underperiod), Day #26 under 60%, Day #149 under 70%
Daily AT40 (T2108)
")
Black line: AT40 (T2108) (% measured on the right)
Red line: Overbought threshold (70%); Blue line: Oversold threshold (20%)
Weekly AT40 (T2108)

*All charts created using freestockcharts.com unless otherwise stated
The charts above are my LATEST updates independent of the date of this given AT40 post. For my latest AT40 post click here.
Related links:
The T2108 Resource Page
You can follow real-time T2108 commentary on twitter using the #T2108 or #AT40 hashtags. T2108-related trades and other trades are occasionally posted on twitter using the #120trade hashtag.
Be careful out there!
Full disclosure: long TGT, long CAT puts, long AAPL calls, long TSLA put, long ULTA, long CMG call
*Charting notes: FreeStockCharts.com uses midnight U.S. Eastern time as the close for currencies. Stock prices are not adjusted for dividends.