
AT40 = 31.8% of stocks are trading above their respective 40-day moving averages (DMAs)
AT200 = 46.2% of stocks are trading above their respective 200DMAs
VIX = 15.6 (32.5% increase)
Short-term Trading Call: neutral
Commentary
Looks like I was over-optimistic to switch my short-term trading call from neutral to bullish. Now I am right back to neutral.
I was trying to get ahead of what looked to be a recovery from “close enough” to oversold conditions and chose not to wait, as I usually do, for confirmation. Instead, AT40 (T2108), the percentage of stocks trading above their respective 40-day moving averages (DMAs), plunged right back to “close enough” oversold levels. My favorite technical indicator closed the day at 31.8%. This level is not only a new 2017 low, but also it is a post-election low. AT200 (T2107), the percentage of stocks trading above their respective 200DMAs, fared even worse. AT200 closed at a new 16-month low! Together, these indicators tell me the market’s internals are very weak and NOT in recovery mode. Sellers managed to pull off a rare rally rejection. So it is no surprise then to see in parallel that the S&P 500 (SPY) lost 1.5% on its way to a new 5-week low. The index effectively closed the bullish gap up and breakout from July 12th.
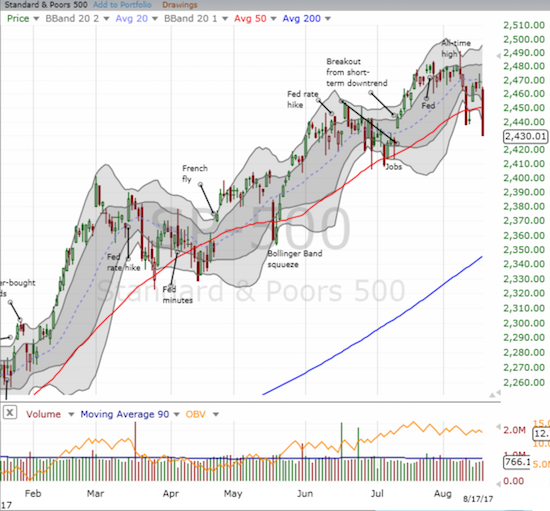
With the fade from all-time highs on August 8th preceding the last 1-day plunge, a bearish evening star preceding today’s 1-day plunge, and a now declining 20DMA, the S&P 500 suddenly looks ready to confirm my on-going assertion that the index has limited upside through at least September/October. Going forward, I am definitely not switching to a bullish short-term trading call without confirmation: a close above 2475 for the S&P 500 which would conquer the bearish evening star. I will of course swing to (cautiously) bullish on true oversold conditions (AT40 below 20%).
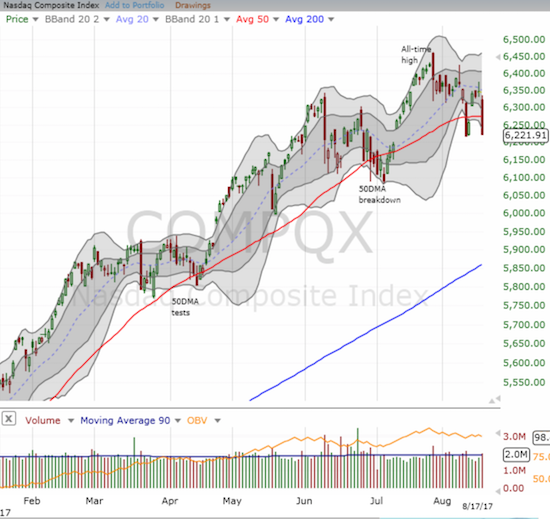
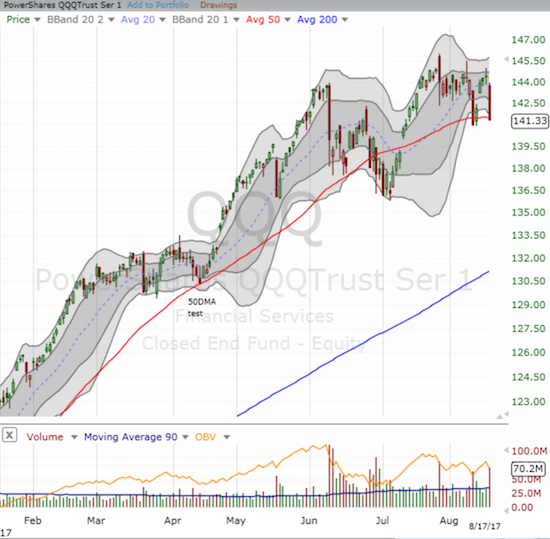
The NASDAQ lost 1.9% but did not crack the low from the last 1-day plunge; ditto for the PowerShares QQQ Trust (QQQ) which managed to cling to its 50DMA support and keep its 20DMA from declining.
SwingTradeBot further confirmed the short-term bearish action by showing a dominance of bearishness across major indices and timeframes.
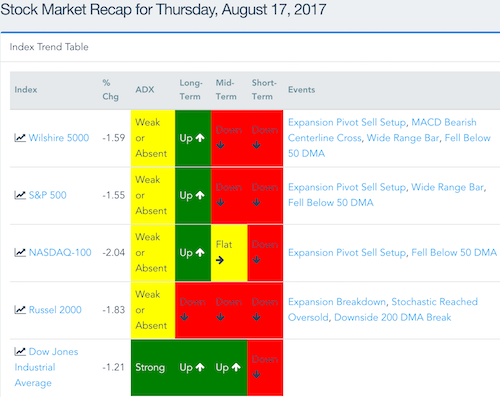
Source: SwingTradeBot
The volatility index was strong early in the day, but it took me a while to realize that my bullish posture was misplaced. The VIX surged a whopping 32.5% increase for a close just above the all-important 15.35 pivot.
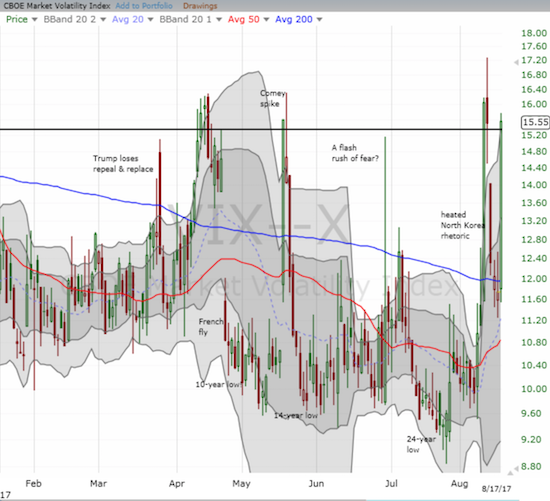
The outlook reversed so convincingly that I did not bother this time to try to fade volatility. A low-ball limit order for a fresh 2-week call on ProShares Ultra VIX Short-Term Futures ETF (UVXY) went unfilled and reminded of how complacent I had become for two days. As a reminder, my on-going strategy for this seasonally weak period for the stock market is to ALWAYS hold call options on UVXY on a 2-week expiration cycle. In hindsight, it was quite telling that these call options were so “expensive” today.
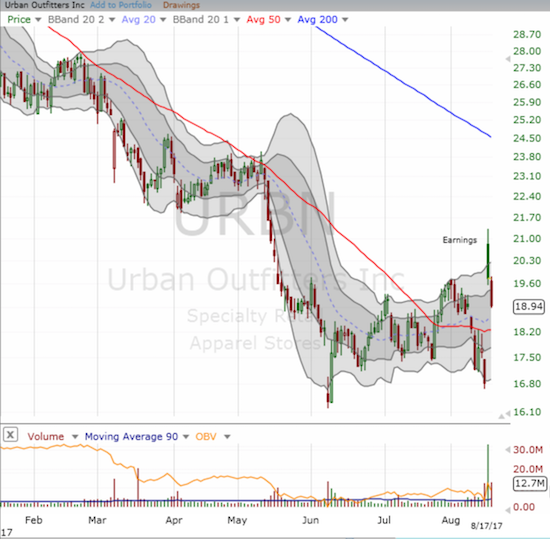
The close on Friday could prove critical in confirming whether the market is actually in a sustainably bad mood here (if I do a bullish trade on Friday, it will start with trying to fade volatility). Given this volatile situation, I will only review the chart of one indicative stock: Urban Outfitters (URBN). I titled the last Above the 40 post “The Retail Wreck Runs Over Strong Data.” I held out URBN as a shining exception because traders sent the stock soaring in after hours in response to earnings. Yesterday, URBN pulled off “a gap and crap”. Today, it sold off more. The 4.2% loss put URBN right back into its previous trading range…and is providing some major relief to the bears who have sold 24.9% of URBN’s float short.
In trading activity, I locked in profits on my iShares Silver Trust (SLV) call options which soared right into 200DMA resistance. I also took advantage of post-earnings volatility in Target (TGT) to lock in profits soon after today’s open. Trades which are likely to go down in flames include Netflix (NFLX) call options and Chipotle Mexican Grill (CMG). Tomorrow, I am VERY likely to lock in profits on Toll Brothers (TOL) and Cognizant Technology (CTSH).
— – —
FOLLOW Dr. Duru’s commentary on financial markets via email, StockTwits, Twitter, and even Instagram!
“Above the 40” uses the percentage of stocks trading above their respective 40-day moving averages (DMAs) to assess the technical health of the stock market and to identify extremes in market sentiment that are likely to reverse. Abbreviated as AT40, Above the 40 is an alternative label for “T2108” which was created by Worden. Learn more about T2108 on my T2108 Resource Page. AT200, or T2107, measures the percentage of stocks trading above their respective 200DMAs.
Active AT40 (T2108) periods: Day #379 over 20%, Day #193 over 30%, Day #1 under 40% (underperiod ending 2 days over 40%), Day #10 under 50%, Day #16 under 60%, Day #139 under 70%
Daily AT40 (T2108)
")
Black line: AT40 (T2108) (% measured on the right)
Red line: Overbought threshold (70%); Blue line: Oversold threshold (20%)
Weekly AT40 (T2108)

*All charts created using freestockcharts.com unless otherwise stated
The charts above are my LATEST updates independent of the date of this given AT40 post. For my latest AT40 post click here.
Related links:
The T2108 Resource Page
You can follow real-time T2108 commentary on twitter using the #T2108 or #AT40 hashtags. T2108-related trades and other trades are occasionally posted on twitter using the #120trade hashtag.
Be careful out there!
Full disclosure: long NFLX calls, long SLV, long CTSH, long TOL, long CMG shares and calls
*Charting notes: FreeStockCharts.com uses midnight U.S. Eastern time as the close for currencies.