
AT40 = 54.4% of stocks are trading above their respective 40-day moving averages (DMAs)
AT200 = 59.4% of stocks are trading above their respective 200DMAs
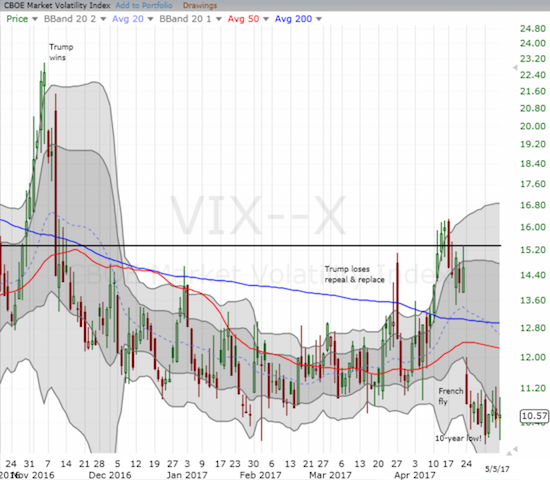
VIX = 10.6 (volatility index)
Short-term Trading Call: bullish
Commentary
Two hallmarks of this current stock market have been the 1) consistent weakness of sellers and 2) the persistent ability of the S&P 500 (SPY) to overcome bearish divergence in the technicals as represented by AT40 (T2108), the percentage of stocks trading over their respective 40DMAs.
In the wake of the U.S. jobs report for April, the S&P 500 (SPY) notched a fresh (marginal) all-time high. As I have noted before, I am gratified to see a market that actually rallies on good news. I grew weary of the post-recovery, easy-money routine of celebrating bad news in anticipation of more goodies from the Fed.
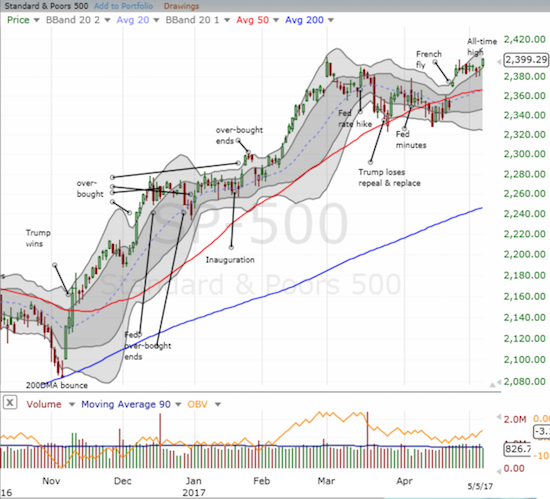
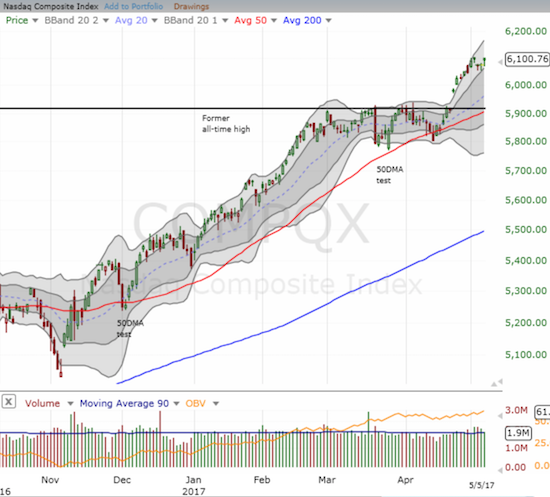
Both the S&P 500 and the NASDAQ (QQQ)* look ready for a fresh rally to their respective upper-Bollinger Bands (BB). Once there, I am guessing the Nazz will have enough momentum to keep climbing the upper-BB just as it did in the last burst higher. This action also greatly reduces the odds of a 50DMA retest for the S&P 500 that I had expected to come this month.
The volatility index is mired in a region of extremely low volatility. Whenever the VIX wakes up again (and it will of course), the move could/should be particularly violent since complacency is getting so thoroughly entrenched in this market. I am continuing to buy calls and puts on ProShares Ultra VIX Short-Term Futures (UVXY) with 2-week expirations in an attempt to be positioned for that next big move. The puts are necessary because there is still room on the political front for policy moves to produce a sudden resurgence of optimism and expectation.
Going into Friday’s mini breakouts, I became more concerned with a potential bearish divergence. While the major indices were idling away on Thursday, both AT40 and AT200 (T2107), the percentage of stocks trading above their respective 200DMAs, dropped steeply. AT40 dropped as low as 46.5% before closing at 50.4%. AT200 traded as low as 54.8% before closing at 56.3%, a new 6-month low. Both the close and the intraday low were last seen the day after the U.S. Presidential election. In almost any other market, I would claim that the indices are living on borrowed time if the rest of the stock market does not catch up. Now, I need a lot more proof before getting convinced that sellers have at least an inkling of firepower.
The regular cast of characters are weighing down AT40 and AT200: the financials, small caps, and mid-caps. This week, the specter of another collapse in commodities loomed over the market.
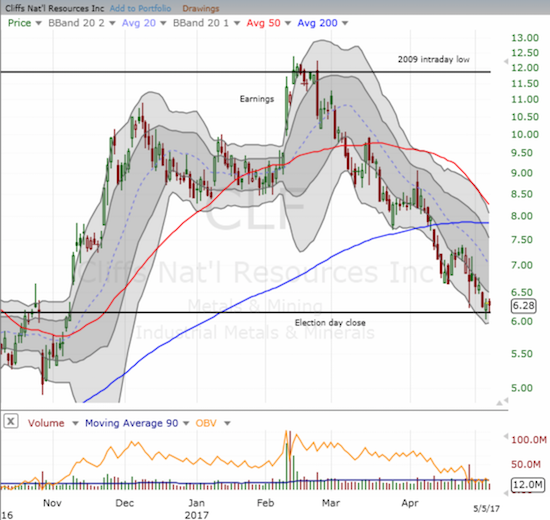
I recently pointed to the renewed troubles in iron ore. Cliffs Natural Resources (CLF) is once again the poster boy of iron ore collapse. Note how perfectly CLF failed to break through its historic (at that time) 2009 intraday low. CLF has now joined the crowded company of equities that have lost all their post-election gains.
I took this opportunity to close out my long-standing short on BHP Biliton (BHP). I have not reactivated the iron ore hedge of Rio Tinto (RIO) vs BHP in a long time. I will be looking for the next opportunity to start over and hope to write a long overdue review of the iron ore sector.
BHP also has significant oil assets (which made it an attractive hedge play against RIO). Yet, somehow all year, I failed to note the persistent downtrend in the Energy Select Sector SPDR ETF (XLE) since its peak in December. On Thursday, XLE closed at a 9-month low!
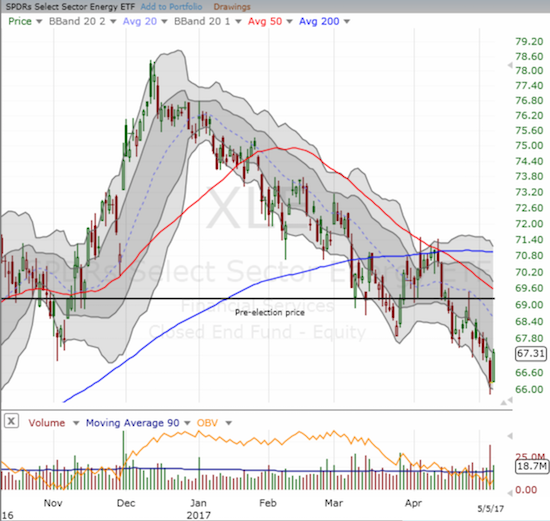
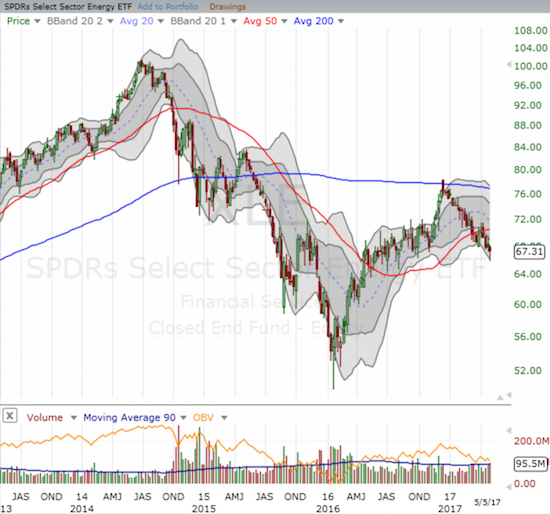
Even with Friday’s 1.6% jump, XLE is down 10.6% for the year. This sector alone likely explains why and how the NASDAQ has so readily sprinted ahead of the S&P 500. The strong downtrend in XLE helps further explain the persistent bearish divergences from earlier in the year. I also now suspect that the general malaise in commodities is/was a major force in sending silver spiraling downward.
The weight of the sell-off in commodities finally caught up with Caterpillar (CAT). CAT failed to follow-through on its major post-earnings gap up. Suddenly, the stock is in danger of reversing all its post-earnings gains and even returning to its pre-earnings consolidation range.
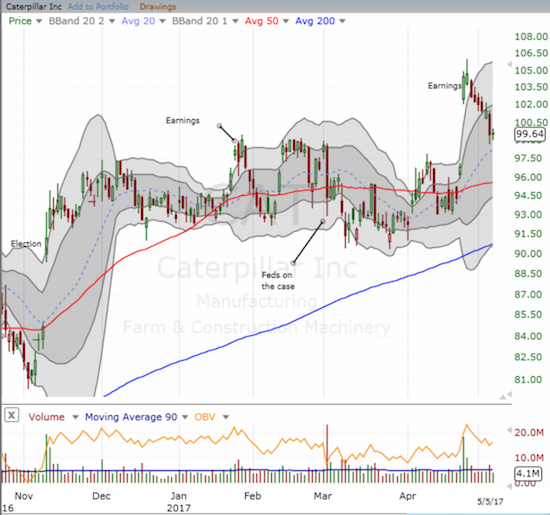
I locked in profits on CAT puts on Thursday’s swoon, again, not confident the sellers can maintain this pressure. The profits were not enough to cover the cost of my call options. I am looking to re-establish a hedged trade soon.
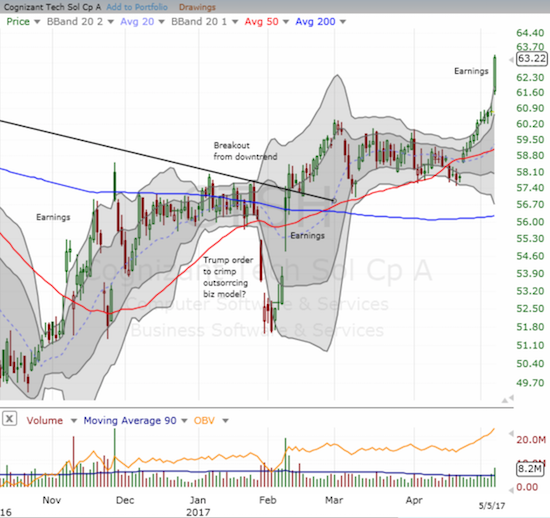
On the good side, I got post-earnings boosts from Cognizant Technology (CTSH) and El Pollo Loco Holdings (LOCO). CTSH rocketed 4.1% higher on Friday in the wake of a very strong earnings report. Even with CTSH trading well above its upper-BB, I am holding on as I think this latest earnings report validated my longer-term bullish thesis on CTSH.
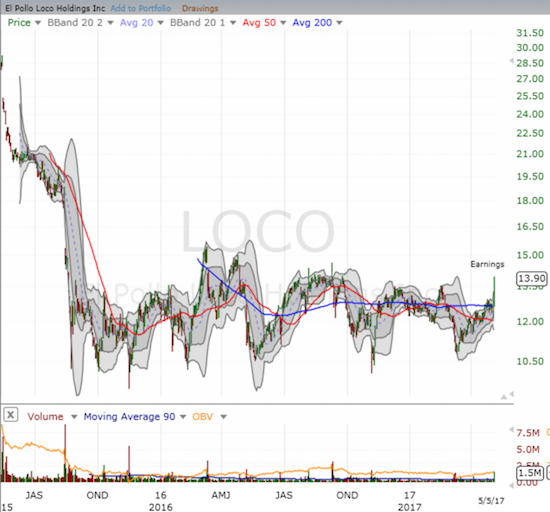
LOCO came into focus for me in mid-February in “Another Chicken Run for Restaurant Brands With El Pollo Loco Rumors.” When Restaurant Brands (QSR) took out my other chicken play Popeyes Louisiana Kitchen (PLKI) (see “QSR Picks Popeyes And Leaves El Pollo Loco As the Last Chicken Standing“), I decided to wait out LOCO and look to buy more in a play on its long-standing trade range. Per my strategy, I bought more shares when LOCO swooned toward the lower end of the range. I was pleasantly surprised to see LOCO rally from there, culminating in a 11.2% pop on Friday in the wake of a positive response to the company’s latest earnings. With the stock trading at the top of the range, I decided to take my profits on the entire position instead of just the last position I added. I am now looking to buy the next LOCO dip. Hopefully it comes before another potential suitor comes a-callin’…
Be careful out there!
— – —
FOLLOW Dr. Duru’s commentary on financial markets via email, StockTwits, Twitter, and even Instagram!
“Above the 40” uses the percentage of stocks trading above their respective 40-day moving averages (DMAs) to assess the technical health of the stock market and to identify extremes in market sentiment that are likely to reverse. Abbreviated as AT40, Above the 40 is an alternative label for “T2108” which was created by Worden. Learn more about T2108 on my T2108 Resource Page. AT200, or T2107, measures the percentage of stocks trading above their respective 200DMAs.
Active AT40 (T2108) periods: Day #304 over 20%, Day #124 over 30%, Day #14 over 40%, Day #11 over 50% (overperiod), Day #6 under 60% (underperiod), Day #76 under 70%
Daily AT40 (T2108)
")
Black line: AT40 (T2108) (% measured on the right)
Red line: Overbought threshold (70%); Blue line: Oversold threshold (20%)
Weekly AT40 (T2108)

*All charts created using freestockcharts.com unless otherwise stated
The charts above are my LATEST updates independent of the date of this given AT40 post. For my latest AT40 post click here.
Related links:
The T2108 Resource Page
You can follow real-time T2108 commentary on twitter using the #T2108 or #AT40 hashtags. T2108-related trades and other trades are occasionally posted on twitter using the #120trade hashtag.
Be careful out there!
Full disclosure: long UVXY call and put options, long CTSH
*Note QQQ is used as a proxy for a NASDAQ-related ETF