
AT40 = 37.4% of stocks are trading above their respective 40-day moving averages (DMAs)
AT200 = 57.8% of stocks are trading above their respective 200DMAs
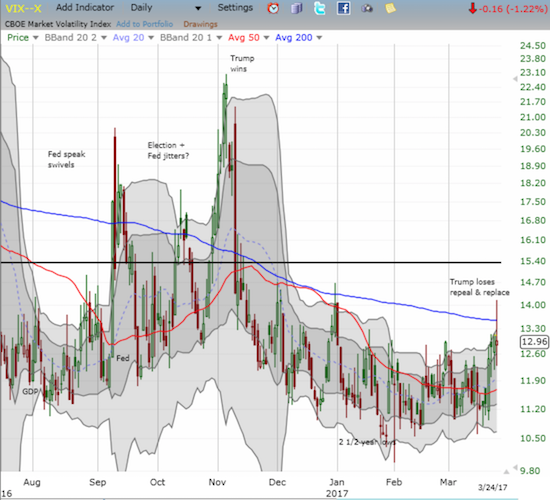
VIX = 13.0 (volatility index)
Short-term Trading Call: bearish
Commentary
In my last “Above the 40“, I noted how the stock market took a pause in deference to the growing bearish sentiment surrounding the political drama in Washington D.C. featuring President Donald Trump’s attempt to repeal and replace Obamacare. Trump ended up losing the vote, but the market’s net reaction was not quite clear given the late confirmation of the news. The S&P 500 (SPY) gapped up slightly at the open, peaked almost two hours later, and then bounced sharply off its low of the day going into the close. The end result was a flat close.
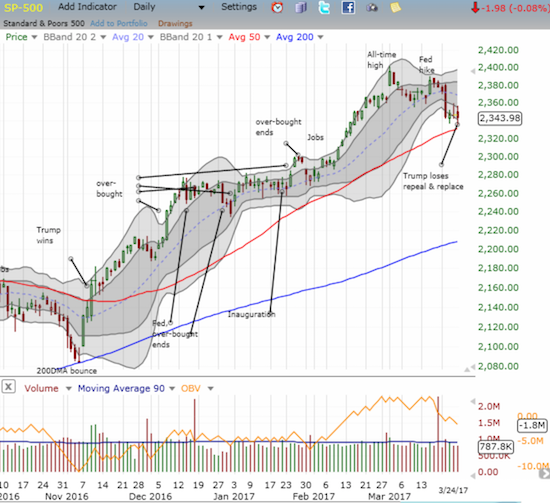
The S&P 500 last touched its 50-day moving average (DMA) when it broke out upon Trump’s Presidential victory. It almost seems poetic for the 50DMA to give up support here.
AT40 (T2108), the percentage of stocks trading above their respective 40DMAs, closed with a slight loss at 37.4%. AT40 remained entrenched in a new and steep downtrend.
The volatility index, the VIX, more clearly put angst on display. While the VIX closed with a slight loss, it gained as much as 7.9% at its high of the day. That high marked the first time the VIX crossed its downtrending 200DMA since the end of 2016. I was looking for a volatility implosion once the news of repeal and replace became known regardless of the outcome. That implosion did indeed occur in the last 45 minutes of trading as the VIX quickly slid off its high of the day. I will be looking for implosion follow-through in the coming week to flag whether bulls will manage to keep 50DMA support intact for the S&P 500.
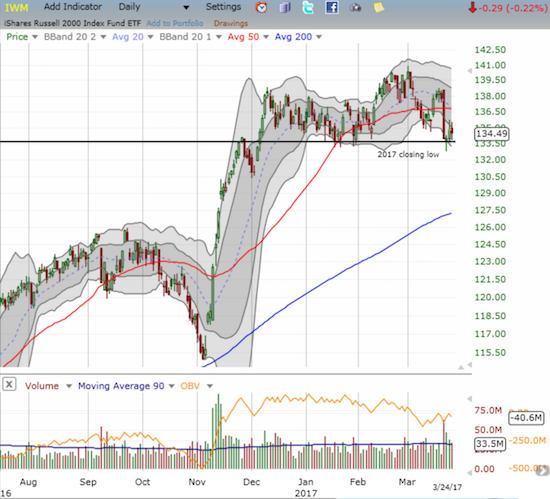
Small caps are doing their part trying to hold up the pillars of the bull. At its low of the day, the iShares Russell 2000 (IWM) traded down to its 2017 closing low and then bounced. That test was the fourth consecutive daily test. The struggle here is no accident: the bears and bulls clearly understand the technical significance of a break here: IWM could put its 200DMA uptrending support into play as it quickly slides into a reversal of most of its post-election gains.
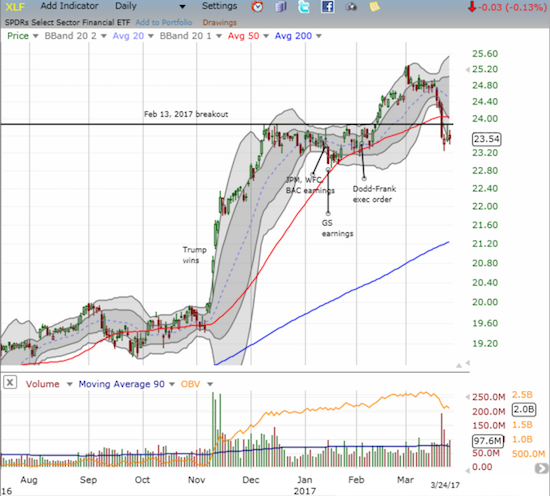
Financials have work ahead to recover the peak of its recent glory. Just as IWM taps its feet on support, the Financial Select Sector SPDR ETF (XLF) is stretching to recover the point of its 2017 breakout and then its 50DMA. The past three days of churn look like a holding pattern ahead of a fresh swoosh downward.
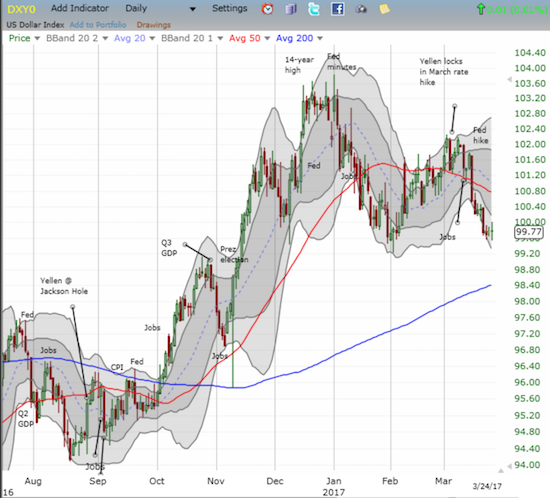
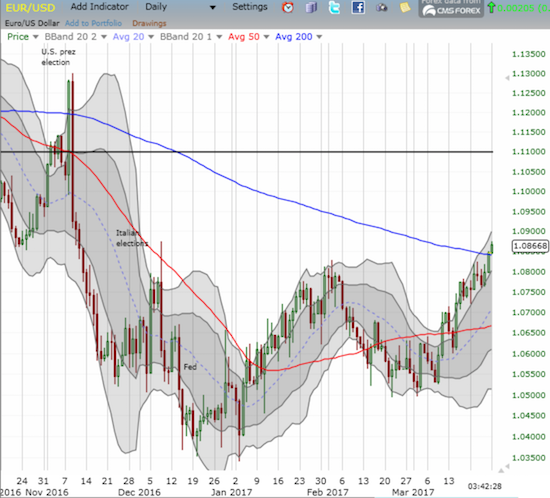
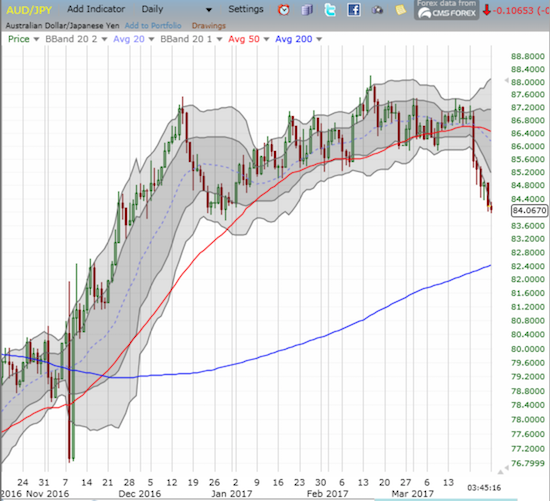
While stocks may meander looking for further direction from D.C., the currency market may provide clearer signals on the financial market’s sentiment toward the U.S. market. The U.S. dollar index (DXY0) last peaked when U.S. Federal Reserve Chair Janet Yellen confirmed a March rate hike was on its way. The news of the hike created follow-through selling. The selling continued until the last three days of last week. Trading as of writing indicates that Monday will be another rough day for the U.S. dollar index as EUR/USD has broken out above its 200DMA resistance. I daresay waning interest and confidence in the U.S. dollar will NOT be good for U.S. stocks this time around. The continued decline in the Australian dollar (FXA) versus the Japanese yen (FXY) (AUD/JPY) confirms the stock market’s weakening foundation.
Interestingly, speculators continue to back down from shorts against the euro. Net short contracts are at their lowest point since speculators last flipped from net long almost three years ago (May, 2014). The retreat began right around the U.S. Presidential election and took a pause from late January to early March. I cannot believe I am saying this, but it might be time to start buying the dips in the euro…
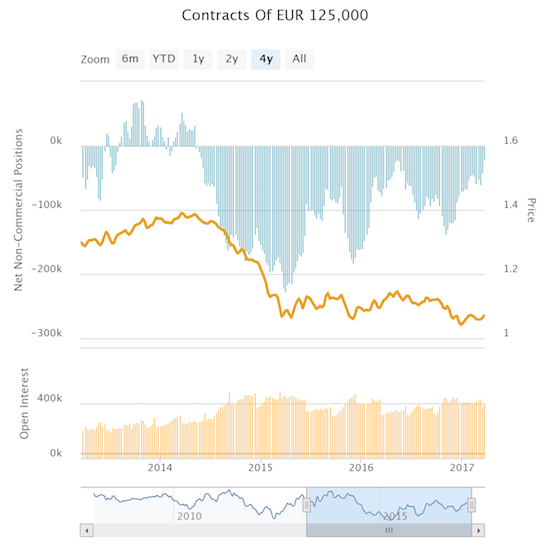
Source: Oanda’s CFTC’s Commitment of Traders
— – —
FOLLOW Dr. Duru’s commentary on financial markets via email, StockTwits, Twitter, and even Instagram!
“Above the 40” uses the percentage of stocks trading above their respective 40-day moving averages (DMAs) to assess the technical health of the stock market and to identify extremes in market sentiment that are likely to reverse. Abbreviated as AT40, Above the 40 is an alternative label for “T2108” which was created by Worden. Learn more about T2108 on my T2108 Resource Page. AT200, or T2107, measures the percentage of stocks trading above their respective 200DMAs.
Active AT40 (T2108) periods: Day #276 over 20%, Day #96 over 30% (overperiod), Day #4 under 40% (underperiod), Day #5 under 50%, Day #17 under 60%, Day #48 under 70%
Daily AT40 (T2108)
")
Black line: AT40 (T2108) (% measured on the right)
Red line: Overbought threshold (70%); Blue line: Oversold threshold (20%)
Weekly AT40 (T2108)

*All charts created using freestockcharts.com unless otherwise stated
The charts above are my LATEST updates independent of the date of this given AT40 post. For my latest AT40 post click here.
Related links:
The T2108 Resource Page
You can follow real-time T2108 commentary on twitter using the #T2108 or #AT40 hashtags. T2108-related trades and other trades are occasionally posted on twitter using the #120trade hashtag.
Be careful out there!
Full disclosure: long SDS, long and short various currency pairs on the U.S. dollar