(T2108 measures the percentage of stocks trading above their respective 40-day moving averages [DMAs]. It helps to identify extremes in market sentiment that are likely to reverse. To learn more about it, see my T2108 Resource Page. You can follow real-time T2108 commentary on twitter using the #T2108 hashtag. T2108-related trades and other trades are occasionally posted on twitter using the #120trade hashtag. T2107 measures the percentage of stocks trading above their respective 200DMAs)
T2108 Status: 68.6%
T2107 Status: 63.0%
VIX Status: 11.8
General (Short-term) Trading Call: bullish
Active T2108 periods: Day #200 over 20%, Day #20 over 30%, Day #19 over 40%, Day #17 over 50%, Day #11 over 60% (overperiod), Day #90 under 70%
Commentary
After a bit of a hiccup since the last T2108 Update, the stock market is back on track. The breather for the S&P 500 (SPY) seems to be over with T2108 at 68.6% and just below the 70% overbought threshold. The S&P 500 closed today just one point off its all-time high set on November 25th.
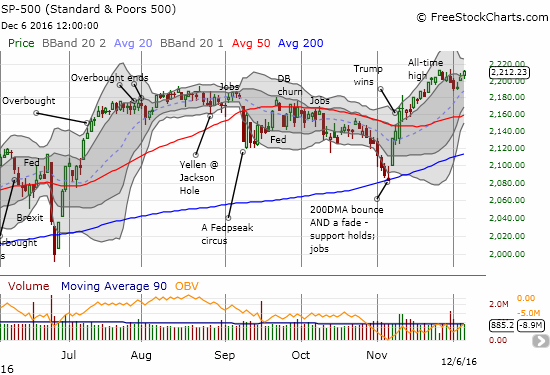
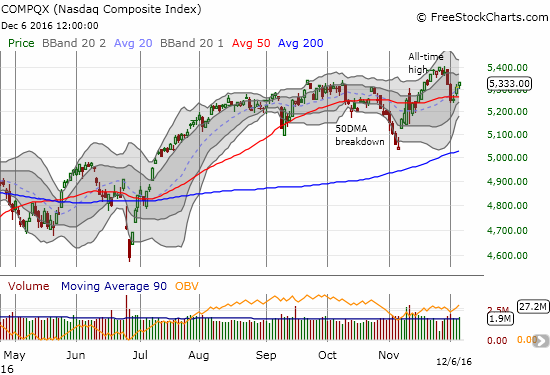
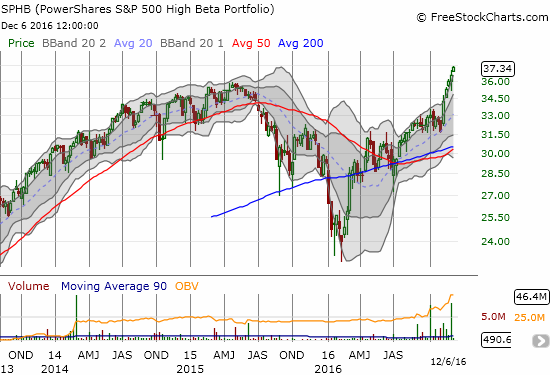
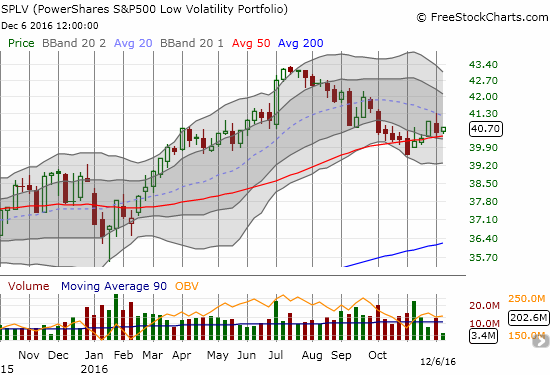
The S&P 500 looks ready to break out mainly thanks to the high beta components of the index. PowerShares S&P 500 High Beta ETF (SPHB) is already making new all-time highs after last month’s breather. The PowerShares S&P 500 Low Volatility ETF (SPLV) remains the laggard slowing down the action. I use a weekly chart for SPHB to show perspective. The flash crash from 2015 prevents me from showing an extended weekly for SPLV.
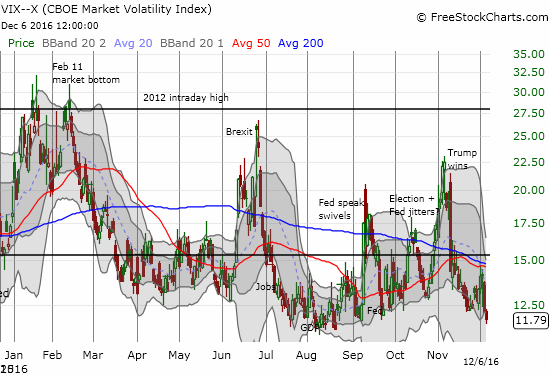
Needless to say, my short-term trading call remains bullish. The volatility index, the VIX, is a potential caveat. The VIX is hovering above its lows for the year. The post-election run-off for volatility appears set to continue, but complacency is already reaching “maximum” levels.
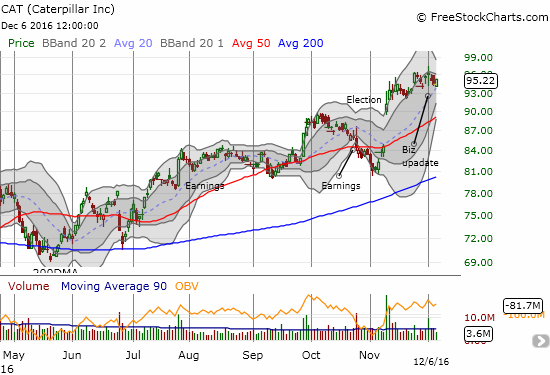
I also feel a little uneasy anticipating a major breakout and overbought rally with an important Federal Reserve meeting just a week away. A new hedge in Catepillar (CAT) is helping me a bit with the unease. Last week, CAT released a sales update that seemed to take the steam out of the celebratory optimism that has accompanied the stock for quite some time – an enthusiasm that accelerated after the U.S. Presidential election (quote from Seeking Alpha transcripts – emphasis mine):
“Now let’s look at EPS excluding restructuring as reflected in the Thomson First Call Consensus, which is on Slide 8. In our view that current consensus of $3.25 on $38 billion of sales is too optimistic given expected headwinds. While we are still in the process of finalizing our 2017 plans for profit in cash flow, I wanted to review some of the headwinds that we know exist. Let’s start on the positive side of the ledger for profit. We expect $300 million to $400 million of cost reduction to carryover into 2017 from all the restructuring actions that we took this year, but now let’s look at the other side of the ledger.
On $1 billion of lower sales versus 2016, which is reflected in the Thomson First Call Consensus, we would expect that profit impacts that’s a variable margin rate of somewhere between $350 million to $450 million, variable margin as we define it as the selling price to dealers minus the variable input cost like material and labor.”
The news caused the stock to drop quickly from its high of the day, and I bought a handful of January put options. CAT has done well to stabilize since then. Note well in the chart below how a Bollinger Band (BB) squeeze is developing (meaning that a big breakout, up or down, from low volatility is likely coming soon).
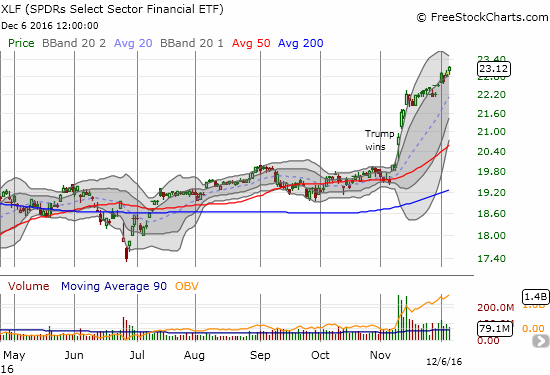
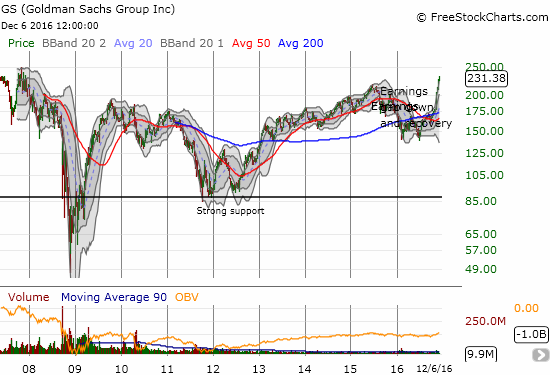
On the side of unadulterated bullishness, we stil have the financials. In the last T2108 Update, I relished finally landing a handful of call options in the Financial Select Sector SPDR ETF (XLF) at my target price. Incredibly, just two days later, that position increased around 150% in value as XLF hit a fresh 52-week high. I took my profits at that point. Since then, buyers pushed XLF to a fresh breakout and a near 9-year high.
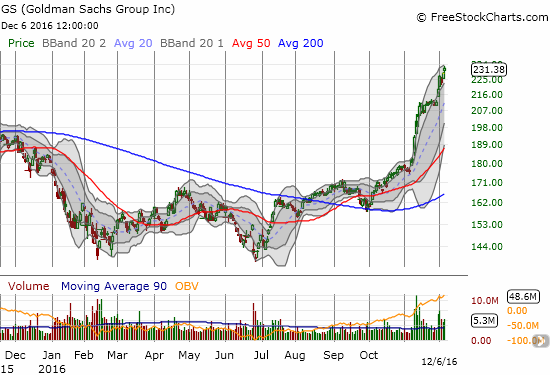
When I last noted XLF’s momentum, I should have shown one of the clear leaders of that momentun: Goldman Sachs (GS). I think this chart says it all. Just looking at it should remind you to stay bullish this market for now.
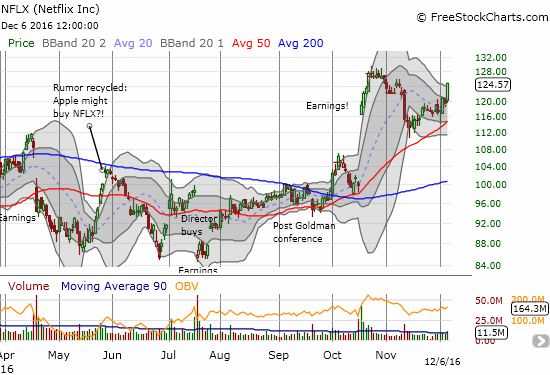
A friendly reminder from Netflix (NFLX) that tech and the internet economy is not quite dead yet… (compare to Facebook’s slow breakdown).
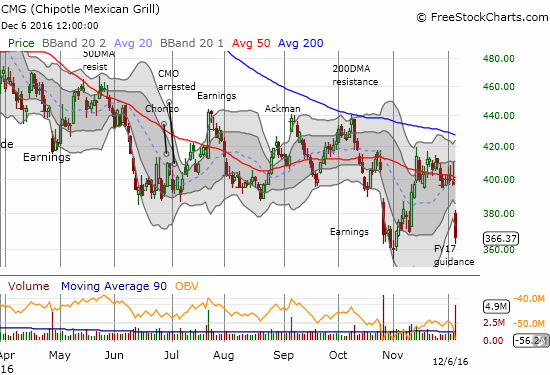
Finally, on the flip side, Chipotle Mexican Grill (CMG) is pushing on a fresh 3 1/2 year low as FY17 guidance severely disappoints the market. How much longer before Ackman makes a move at the board to try to save his recent investment from going down the tubes?
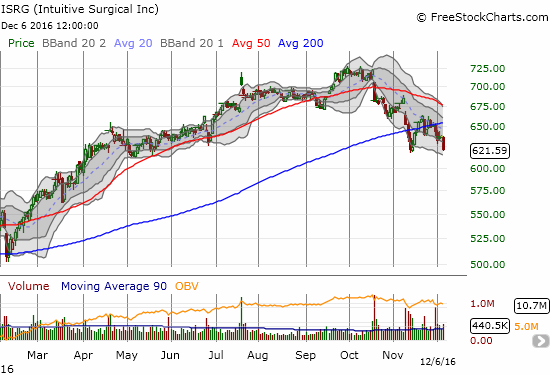
Finally, the health care sector has major post-election struggles. Medical device companies like Intuitive Surgical (ISRG) are flirting with major breakdowns. Last month’s attempt to regain support at the 200-day moving average (DMA) failed. A break of November’s low would confirm 200DMA resistance and put an extended slide into play.
— – —
FOLLOW Dr. Duru’s commentary on financial markets via email, StockTwits, Twitter, and even Instagram!
Daily T2108 vs the S&P 500

Black line: T2108 (measured on the right); Green line: S&P 500 (for comparative purposes)
Red line: T2108 Overbought (70%); Blue line: T2108 Oversold (20%)
Weekly T2108

*All charts created using freestockcharts.com unless otherwise stated
The charts above are the my LATEST updates independent of the date of this given T2108 post. For my latest T2108 post click here.
Related links:
The T2108 Resource Page
Be careful out there!
Full disclosure: long UVXY shares and short UVXY call options, long CMG call and put options
