
(T2108 measures the percentage of stocks trading above their respective 40-day moving averages [DMAs]. It helps to identify extremes in market sentiment that are likely to reverse. To learn more about it, see my T2108 Resource Page. You can follow real-time T2108 commentary on twitter using the #T2108 hashtag. T2108-related trades and other trades are occasionally posted on twitter using the #120trade hashtag. T2107 measures the percentage of stocks trading above their respective 200DMAs)
T2108 Status: 72.2% (first overbought day)
T2107 Status: 65.2%
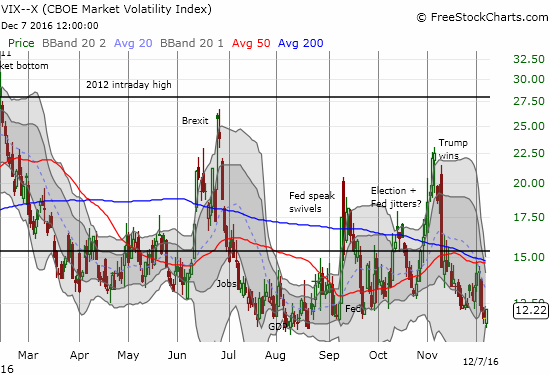
VIX Status: 12.2
General (Short-term) Trading Call: bullish
Active T2108 periods: Day #201 over 20%, Day #21 over 30%, Day #20 over 40%, Day #18 over 50%, Day #12 over 60%, Day #1 over 70% (overbought day #1 ended 90 days under 70%)
Commentary
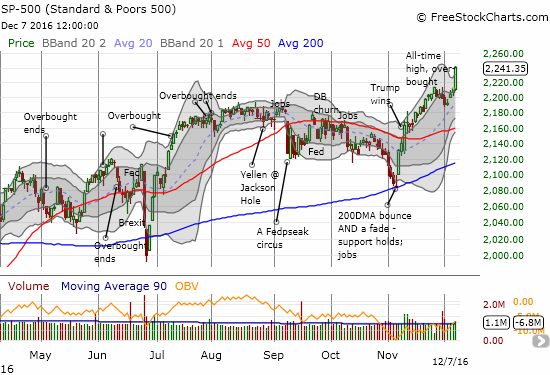
The U.S. stock market tends to perform better under a divided government. However, you might not beieve that old Wall Street adage based on the 4.8% gain in the S&P 500 in just a month’s time since Republicans effectively took over the entire Federal government in the wake of the U.S. 2016 elections. The market has become downright giddy over the prospects of a federal government prepared and able to spend and cut taxes with little resistance.
I paid no attention to the old adage when I staked my claim on the bull in the election’s aftermath:
“In these cases where theme-based trading and investing first blasts off, it can be tempting to think you can outsmart the market. For example, you might think that the earnings power in some industry cannot possibly meet investor expectations. Or perhaps you look at recent technical history and conclude that a reversion will surely come once the market returns to its “senses.” I think differently. The market is telling us that something fundamental has changed about the market’s underlying conditions. At this stage, many theories may take months, maybe even a year or two to come to fruition…or to fail. In that time, you can miss a LOT of healthy gains…This is NOT the time to argue with the market. This is a time to follow it. Buying dips is the safest approach to playing the new themes.”
Almost one month later, the S&P 500 (SPY) has surged into overbought territory after a hiatus of 90 trading days and a bit of flirting with the overbought threshold. T2108, the percentage of stocks trading above their respective 40-day moving averages (DMAs), closed at 72.2% which is above the 70% threshold for overbought trading conditions. The 1.3% gain for the S&P 500 printed a fresh all-time high as part of a very bullish breakout.
Interestingly, the volatility index, the VIX gained on the day. I interepret this as a move by big money to buy put options to protect gains going into the close of the year…or a rush of skeptics betting that the market’s breakout represents the final stretch of a rubberband.
A breakout to a new all-time high alongside overbought conditions is a very bullish combination. I am still uneasy with this breakout happening ahead of next week’s Federal Reserve meeting, but I am sticking with the bullish short-term trading call. I fully expect some turbulence around the Fed meeting and will treat a related dip in the market as a buying opportunity. Soon after the Fed should be a “Santa rally” and then there is January with a recovery in the stocks unfortunate enough to get caught in the crosshairs of counter-trend selling going into year-end.
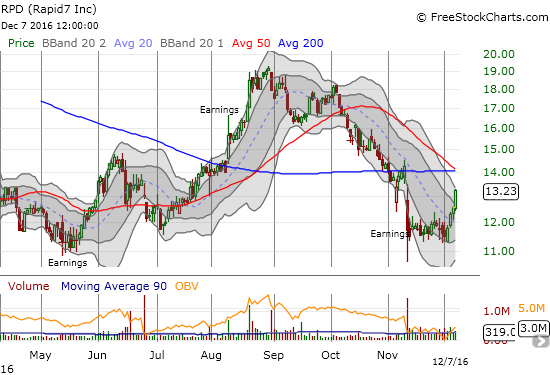
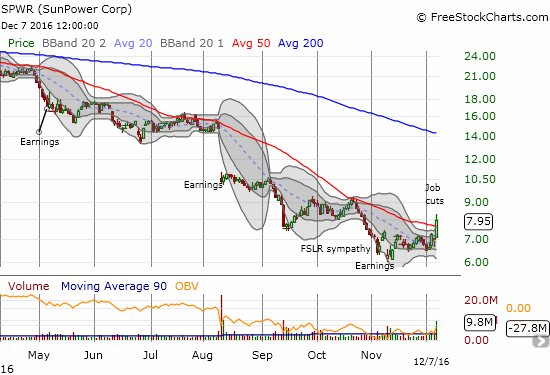
Two potential January-effect stocks I have on my list are cybersecurity company Rapid7, Inc. (RPD) and solar company SunPower Corporation (SPWR).
I started accumulating shares in RPD after its last earnings report received a -17.8% reception. Since then, RPD has not gone much lower during a period of consolidation. RPD broke out of that range this week and is now angling to reverse its post-earnings loss. Overhead resistance looming from the converged 50 and 200DMAs are the biggest technical risks ahead.
In late September, I sold a 2018 put option on First Solar (FSLR) to play what I thought was the pattern of a beaten up stock finally printing a bottom. I turned out to be early. Next up is SunPower (SPWR). Today the stock soared 14.2% on news of job cuts as part of a restructuring. The company also reaffirmed 2017 guidance. I have put the stock on my radar as it now has the potential to rally well into January. Unlike FSLR, I am treating this as more of a short-term play with a very clear stop under the last low. The next earnings announcement will not likely come until February, so I am assuming this trade has some runway ahead of it.
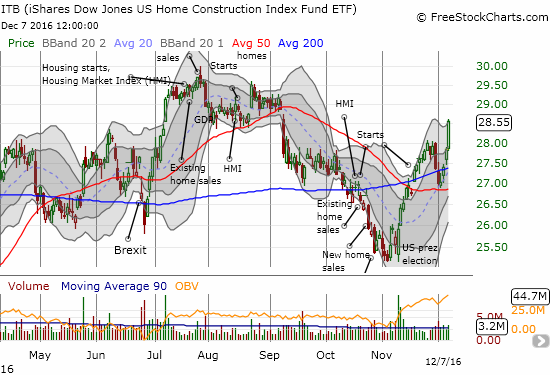
The market’s breakout gave me a great start to my seasonal trade on iShares U.S. Home Construction ETF (ITB) call options. ITB’s 2.5% gain was another example of the breadth of the bullishness in the market.
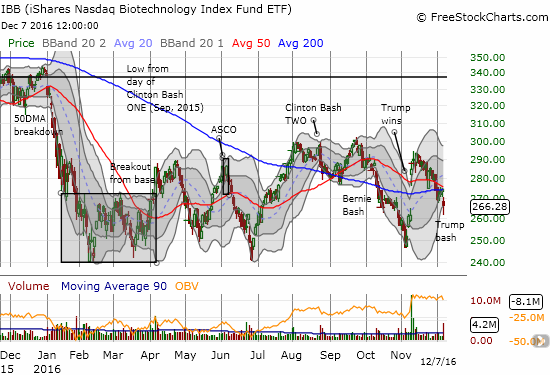
The main blemish on today’s market action was the health care sector. In particular, drug companies came under fire yet again. This time it was President-elect Donald Trump issuing the bash. In a Time Magazine interview Trump had the following to say: “I’m going to bring down drug prices…I don’t like what has happened with drug prices.” Trump provided no specifics, but it was enough to bring back the sellers in force in iShares Nasdaq Biotechnology ETF (IBB). The 2.9% loss confirmed a 50/200DMA breakdown for IBB. The irony of the “Trump bash” is that IBB participated in the immediate post-election celebration. At the lows of the day, IBB finished a complete reversal of its post-election gain. A retest of the November low is now in play.
Going forward, I plan to aggressively play the breakout in the S&P 500. I am hoping for an immediate pullback to at least the edge of the upper-Bollinger Band. Absent that, I will look for some kind of selling pressure going into or immediately following next week’s Federal Reserve meeting. Stay tuned.
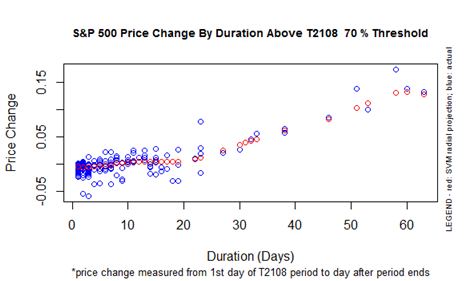
As a reminder, here is my chart mapping the historical performance of the S&P 500 versus the duration of overbought periods. Recall that the 20 to 23 trading day mark is a key divider between modest gains and a large extended overbought rally. To accomodate the most bullish scenario, I will be targeting shares and January call options.
— – —
FOLLOW Dr. Duru’s commentary on financial markets via email, StockTwits, Twitter, and even Instagram!
Daily T2108 vs the S&P 500
")
Black line: T2108 (measured on the right); Green line: S&P 500 (for comparative purposes)
Red line: T2108 Overbought (70%); Blue line: T2108 Oversold (20%)
Weekly T2108

*All charts created using freestockcharts.com unless otherwise stated
The charts above are the my LATEST updates independent of the date of this given T2108 post. For my latest T2108 post click here.
Related links:
The T2108 Resource Page
Be careful out there!
Full disclosure: long UVXY shares and short UVXY call options, short FSLR put options, long ITB call options, long RPD