
(T2108 measures the percentage of stocks trading above their respective 40-day moving averages [DMAs]. It helps to identify extremes in market sentiment that are likely to reverse. To learn more about it, see my T2108 Resource Page. You can follow real-time T2108 commentary on twitter using the #T2108 hashtag. T2108-related trades and other trades are occasionally posted on twitter using the #120trade hashtag. T2107 measures the percentage of stocks trading above their respective 200DMAs)
T2108 Status: 35.4%
T2107 Status: 52.3%
VIX Status: 18.7 (16.9% drop)
General (Short-term) Trading Call: bullish
Active T2108 periods: Day #181 over 20%, Day #1 over 30% (overperiod ending 6 days under 30%), Day #12 under 40%, Day #29 under 50%, Day #44 under 60%, Day #70 under 70%
Commentary
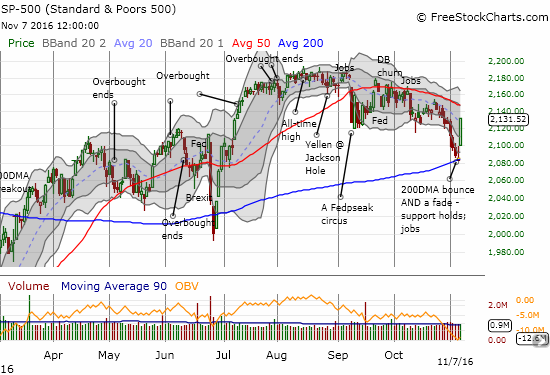
Two days straight of bullish divergences erupted in nearly the most bullish way possible. The S&P 500 (SPY) started the week with a gap up and never looked back. After the dust settled, the index logged a gain of 2.2%. The main thing missing from this move was a breakout – like over declining resistance at its 50-day moving average (DMA). The index closed nearly on top of its declining 20DMA.
T2108, the percentage of stocks trading above their respective 40-day moving averages (DMAs), underlined the bullish tone of the day. T2108 confirmed “support” at the threshold of oversold levels (20%) with a massive 12.2 percentage point gain from 23.2% to 35.4%.
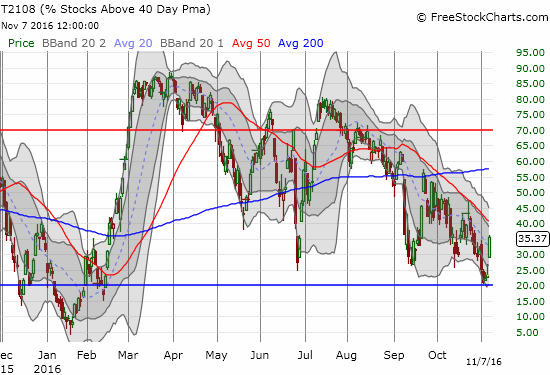
While T2108 made a very bullish move, the 4-month downtrend remains a note of caution. Similarly, while volatility cratered with a 16.9% loss, the VIX is still well above the 15.35 pivot line. Still, it is at least below the 20 level which conventionally defines “high.” This move should be the beginning of the end of the latest volatility spike, but I suspect the path back to and below the pivot line will not be nearly as straight as the path straight up to the recent high.
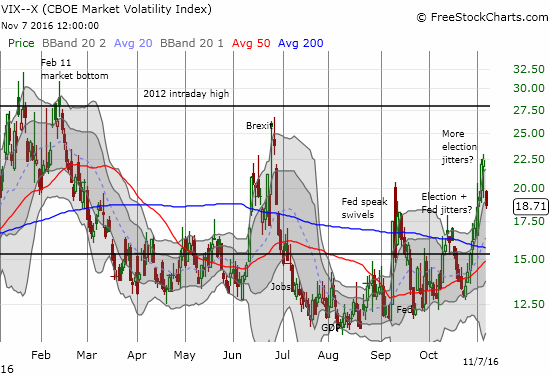
I took this opportunity to sell my puts in ProShares Ultra VIX Short-Term Futures (UVXY). The profits partially offset the losses I incurred last week trying to fade voalitility. In the near-term I plan to fade any further volatility spikes. Per the rules I laid out in the last T2108 Update, I have switched the short-term trading call from cautiously bullish to bullish. I hope to buy a dip in the S&P 500 and use the recent low and 200DMA as a clear stop. The first upside target will be the (declining) 50DMA.
The week ahead likely has more surprises ahead, especially with a U.S. Presidential election on tap. So I will end with just one stock chart: Cognizant Technology (CTSH). The information technology outsourcing firm soared on well-received earnings. The 5.1% gain closed the September gap down which marks news of an internal invesitgation and the resignation of CTSH’s president.
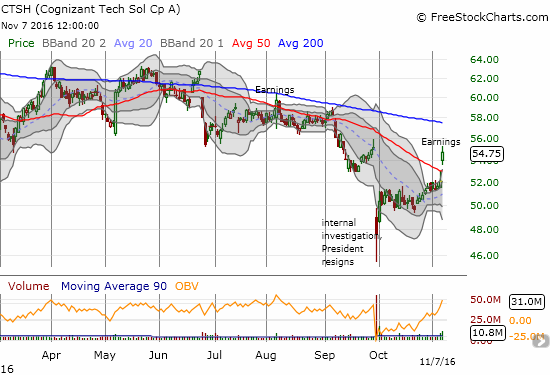
I assume CTSH is a buy on the dips going forward with the 50DMA as support, formerly resistance.
— – —
FOLLOW Dr. Duru’s commentary on financial markets via email, StockTwits, Twitter, and even Instagram!
Daily T2108 vs the S&P 500
")
Black line: T2108 (measured on the right); Green line: S&P 500 (for comparative purposes)
Red line: T2108 Overbought (70%); Blue line: T2108 Oversold (20%)
Weekly T2108

*All charts created using freestockcharts.com unless otherwise stated
The charts above are the my LATEST updates independent of the date of this given T2108 post. For my latest T2108 post click here.
Related links:
The T2108 Resource Page
Be careful out there!
Full disclosure: long UVXY shares and short UVXY call