
(T2108 measures the percentage of stocks trading above their respective 40-day moving averages [DMAs]. It helps to identify extremes in market sentiment that are likely to reverse. To learn more about it, see my T2108 Resource Page. You can follow real-time T2108 commentary on twitter using the #T2108 hashtag. T2108-related trades and other trades are occasionally posted on twitter using the #120trade hashtag. T2107 measures the percentage of stocks trading above their respective 200DMAs)
T2108 Status: 36.5%
T2107 Status: 62.5% (3-month low)
VIX Status: 15.9
General (Short-term) Trading Call: neutral
Active T2108 periods: Day #164 over 20%, Day #20 over 30%, Day #2 under 40% (underperiod), Day #8 under 50%, Day #24 under 60%, Day #50 under 70%
Commentary
In my last T2108 Update, I called the apparent stalemate in the S&P 500 (SPY) “deceptive.” Almost on cue, the index lost over 1% two trading days later in a move that puts last month’s low in play for a test of support.
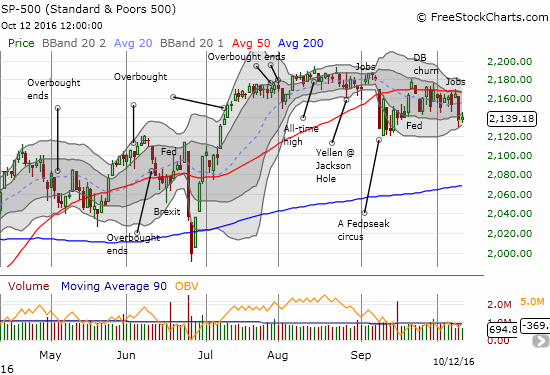
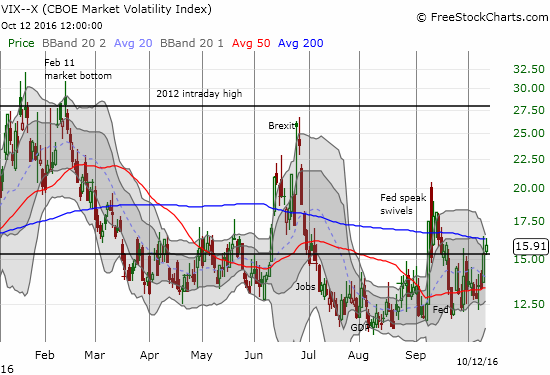
Per my strategy, I loaded up on SPY put options on Monday as the index retested resistance at its 50-day moving average (DMA). I locked in profits during the sell-off but I was much too fast. As the sell-off extended, I began to look for bullish trading opportunities in anticipation of the next bounce back to resistance. I felt justified given the volatility index, the VIX, remained below the 15.35 pivot, and T2108, the percentage of stocks trading above their respective 40DMAs, was sinking into the low to mid 30s (now at 36.5% and still “close enough” to oversold territory for a quick bounce).
However, the next bounce may be more elusive than the typical pattern over the last month. The VIX has now closed ABOVE the 15.35 pivot. This move opens up the ominous potential for a lot more upside (increase in volatility).
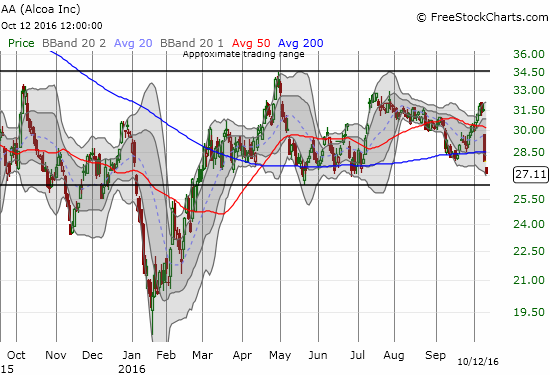
Moreover, earnings season started off poorly with Alcoa (AA) dropping for a huge 11% one-day loss. Sellers followed-up with enough pressure to confirm a 200DMA breakdown. If sellers break through the recent trading range, AA will be at risk for a substantial fall to even retest 2016’s low. (This sell-off was particularly untimely for an analyst with a first-time appearance on Nightly Business Report last Friday who insisted that AA was a buy ahead of its planned spin-off as a nice “safety play”).
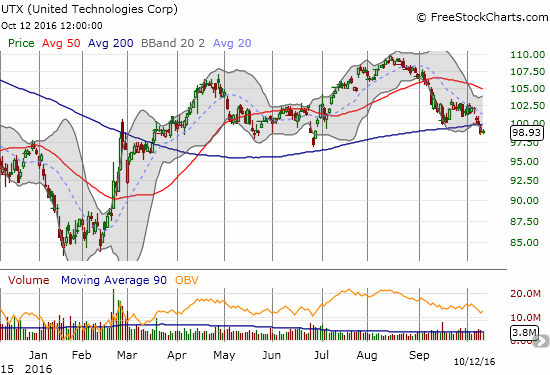
Alcoa has good company as T2107, the percentage of stocks trading above their respective 200DMAs, fell to a fresh 3-month low. United Technologies (UTX) is another important company whose stock has cracked critical 200DMA support. If you look closely, you can almost see the notorious head and shoulders topping formation.
The short-term trading call stays at neutral although dark clouds are forming in the skies. I need to see sellers crack the September low AND follow-through before I can become convinced there is enough bearish firepower in the market. And even THEN, T2108 will likely be so close to oversold (20%) that I will have to stay neutral and even prepare to get aggressively bullish.
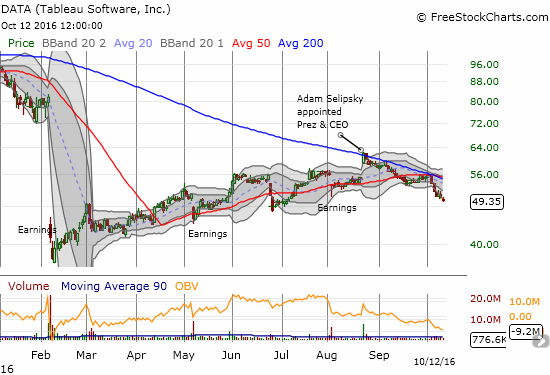
I end with Tableau Software (DATA), one serious enigma of a stock. Each of the three earnings reports have delivered sell-offs…and each time buyers have stubbornly and quickly moved in. So what does it take to exhaust these buyers? GOOD news of course. In the chart below, see how the announcement of a new leader delivered the last peak in the stock. The selling since then has been nearly non-stop. The rejection at converged 50 and 200DMA resistance led to DATA’s first lower low since February’s collapse. This move is a bright red flag for the next earnings cycle…stay tuned.
— – —
FOLLOW Dr. Duru’s commentary on financial markets via email, StockTwits, Twitter, and even Instagram!
Daily T2108 vs the S&P 500
")
Black line: T2108 (measured on the right); Green line: S&P 500 (for comparative purposes)
Red line: T2108 Overbought (70%); Blue line: T2108 Oversold (20%)
Weekly T2108

*All charts created using freestockcharts.com unless otherwise stated
The charts above are the my LATEST updates independent of the date of this given T2108 post. For my latest T2108 post click here.
Related links:
The T2108 Resource Page
Be careful out there!
Full disclosure: long SDS, long UVXY shares and short UVXY call