
(T2108 measures the percentage of stocks trading above their respective 40-day moving averages [DMAs]. It helps to identify extremes in market sentiment that are likely to reverse. To learn more about it, see my T2108 Resource Page. You can follow real-time T2108 commentary on twitter using the #T2108 hashtag. T2108-related trades and other trades are occasionally posted on twitter using the #120trade hashtag. T2107 measures the percentage of stocks trading above their respective 200DMAs)
T2108 Status: 65.6%
T2107 Status: 64.7%
VIX Status: 13.5
General (Short-term) Trading Call: cautiously bullish
Active T2108 periods: Day #78 over 20%, Day #77 over 30%, Day #74 over 40%, Day #8 over 50%, Day #7 over 60% (overperiod), Day #23 under 70% (underperiod)
Commentary
A poor U.S. job’s report brought all sorts of drama in the currency market, but the stock market acted like it barely noticed. The S&P 500 (SPY) dipped but recovered throughout the day to close with a fractional loss. For the week, the index managed the slimmest of gains.
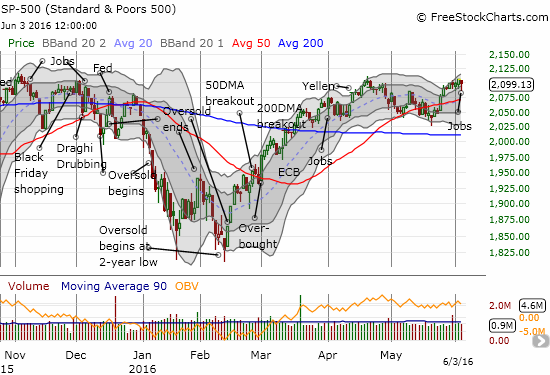
T2108 closed at 66.6% and essentially flat with the previous day. T2107, the percentage of stocks trading above their respective 200-day moving averages (DMA), closed with a small loss that left it comfortably resting in its current uptrend channel. In other words, the (cautiously) bullish posture of the market remains well intact for now despite the surprisingly bad news from the May jobs report. Yet, I cannot help but think that Friday left the market in a state of sudden uncertainty. You cannot see it in the volatility index, the VIX, but the previous thesis that the U.S. has finally entered a recovery strong enough to warrant rate hikes is essentially out the window. Only a new and extremely robust catalyst can reverse the damage to this thesis.
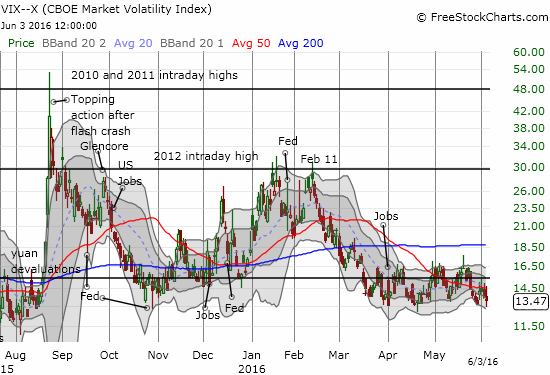
I do not have to turn bearish to see this picture and wonder aloud whether this complacency is far too high (the VIX far too low). It is definitely possible that the market is under-pricing risk because it now expects the Fed to leave rates alone until at best the end of the year. Yet, time and again, the VIX has failed to stay at these levels for long. The risk/reward balance has shifted toward betting on an increase in volatility even if the S&P 500 maintains its generally bullish stance by holding support at its 50DMA or even holding the low of the current trading range.
So my first move this week will be to load up on call options on ProShares Ultra VIX Short-Term Futures (UVXY) for expiration in August or September. I will trade cautiously bullishly from there. As a reminder, an extended failure of T2108 to break into overbought territory (above 70%) will shift me more and more toward the bearish camp over time. Such a failure indicates a weakening of buying power and a build-up selling pressure.
— – —
Reference Charts (click for view of last 6 months from Stockcharts.com):
S&P 500 or SPY
U.S. Dollar Index (U.S. dollar)
EEM (iShares MSCI Emerging Markets)
VIX (volatility index)
VXX (iPath S&P 500 VIX Short-Term Futures ETN)
EWG (iShares MSCI Germany Index Fund)
CAT (Caterpillar).
IBB (iShares Nasdaq Biotechnology).
Daily T2108 vs the S&P 500
")
Black line: T2108 (measured on the right); Green line: S&P 500 (for comparative purposes)
Red line: T2108 Overbought (70%); Blue line: T2108 Oversold (20%)
Weekly T2108

*All charts created using freestockcharts.com unless otherwise stated
The charts above are the my LATEST updates independent of the date of this given T2108 post. For my latest T2108 post click here.
Related links:
The T2108 Resource Page
Expanded daily chart of T2108 versus the S&P 500
Expanded weekly chart of T2108
Be careful out there!
Full disclosure: long NFLX put options, long SSO call options, long P call options